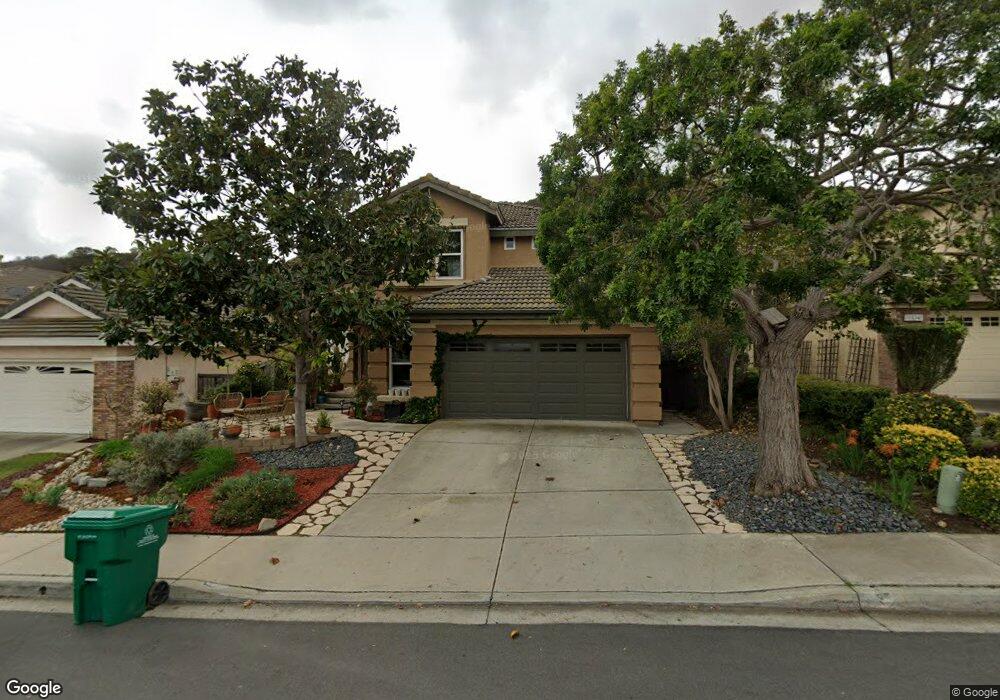
11931 Chalon Ln San Diego, CA 92128
Carmel Mountain NeighborhoodEstimated Value: $1,336,589 - $1,450,000
4
Beds
3
Baths
1,831
Sq Ft
$770/Sq Ft
Est. Value
About This Home
This home is located at 11931 Chalon Ln, San Diego, CA 92128 and is currently estimated at $1,410,647, approximately $770 per square foot. 11931 Chalon Ln is a home located in San Diego County with nearby schools including Shoal Creek Elementary School, Meadowbrook Middle, and Rancho Bernardo High.
Ownership History
Date
Name
Owned For
Owner Type
Purchase Details
Closed on
Sep 30, 2005
Sold by
Foster Stanley E and Foster Jean L
Bought by
Foster Stanley E and Foster Jean L
Current Estimated Value
Purchase Details
Closed on
Jul 21, 1999
Sold by
Barber Timothy P and Barber Eileen L
Bought by
Foster Stanley E and Foster Jean L
Home Financials for this Owner
Home Financials are based on the most recent Mortgage that was taken out on this home.
Original Mortgage
$295,650
Outstanding Balance
$81,572
Interest Rate
7.37%
Estimated Equity
$1,329,075
Purchase Details
Closed on
Jul 7, 1995
Sold by
Smith Steven O and Smith Lynda A
Bought by
Barber Timothy P and Barber Eileen L
Home Financials for this Owner
Home Financials are based on the most recent Mortgage that was taken out on this home.
Original Mortgage
$178,400
Interest Rate
7.62%
Purchase Details
Closed on
Jun 29, 1992
Create a Home Valuation Report for This Property
The Home Valuation Report is an in-depth analysis detailing your home's value as well as a comparison with similar homes in the area
Home Values in the Area
Average Home Value in this Area
Purchase History
| Date | Buyer | Sale Price | Title Company |
|---|---|---|---|
| Foster Stanley E | -- | -- | |
| Foster Stanley E | $328,500 | Chicago Title Co | |
| Barber Timothy P | $223,000 | South Coast Title Company | |
| -- | $225,300 | -- |
Source: Public Records
Mortgage History
| Date | Status | Borrower | Loan Amount |
|---|---|---|---|
| Open | Foster Stanley E | $295,650 | |
| Previous Owner | Barber Timothy P | $178,400 |
Source: Public Records
Tax History Compared to Growth
Tax History
| Year | Tax Paid | Tax Assessment Tax Assessment Total Assessment is a certain percentage of the fair market value that is determined by local assessors to be the total taxable value of land and additions on the property. | Land | Improvement |
|---|---|---|---|---|
| 2025 | $5,238 | $503,334 | $203,295 | $300,039 |
| 2024 | $5,238 | $493,465 | $199,309 | $294,156 |
| 2023 | $5,124 | $483,790 | $195,401 | $288,389 |
| 2022 | $5,045 | $474,305 | $191,570 | $282,735 |
| 2021 | $4,950 | $465,006 | $187,814 | $277,192 |
| 2020 | $4,897 | $460,239 | $185,889 | $274,350 |
| 2019 | $4,772 | $451,216 | $182,245 | $268,971 |
| 2018 | $4,636 | $442,370 | $178,672 | $263,698 |
| 2017 | $4,543 | $433,697 | $175,169 | $258,528 |
| 2016 | $5,180 | $425,194 | $171,735 | $253,459 |
| 2015 | $5,113 | $418,808 | $169,156 | $249,652 |
| 2014 | $5,056 | $410,605 | $165,843 | $244,762 |
Source: Public Records
Map
Nearby Homes
- 12224 Mulholland Ct
- 13731 Sorbonne Ct
- 13737 Esprit Ave
- 12216 Holland Rd
- 12047 Tivoli Park Row Unit 3
- 12061 Tivoli Park Row Unit 3
- 13808 Pomerado Rd
- 12194 Wilsey Way
- 14346 Savannah Ct
- 12026 Riley Ln
- 13751 Powers Rd
- 12127 Corte Napoli
- 11986 Tivoli Park Row
- 14215 Jonah Way
- 14106 Brent Wilsey Place Unit 3
- 13834 Tobiasson Rd
- 14136 Capewood Ln
- 11133 Provencal Place
- 12061 Sienna Ln
- 12021 Sienna Ln
- 11937 Chalon Ln
- 11925 Chalon Ln
- 11943 Chalon Ln
- 11919 Chalon Ln
- 11959 Chalon Ln Unit 22B
- 11911 Chalon Ln
- 11928 Chalon Ln
- 11938 Chalon Ln
- 11920 Chalon Ln
- 11948 Chalon Ln
- 11965 Chalon Ln
- 11907 Chalon Ln
- 11912 Chalon Ln
- 11958 Chalon Ln
- 13549 Scarsdale Way
- 13520 Scarsdale Way
- 11901 Chalon Ln
- 11904 Chalon Ln
- 11971 Chalon Ln
- 11968 Chalon Ln