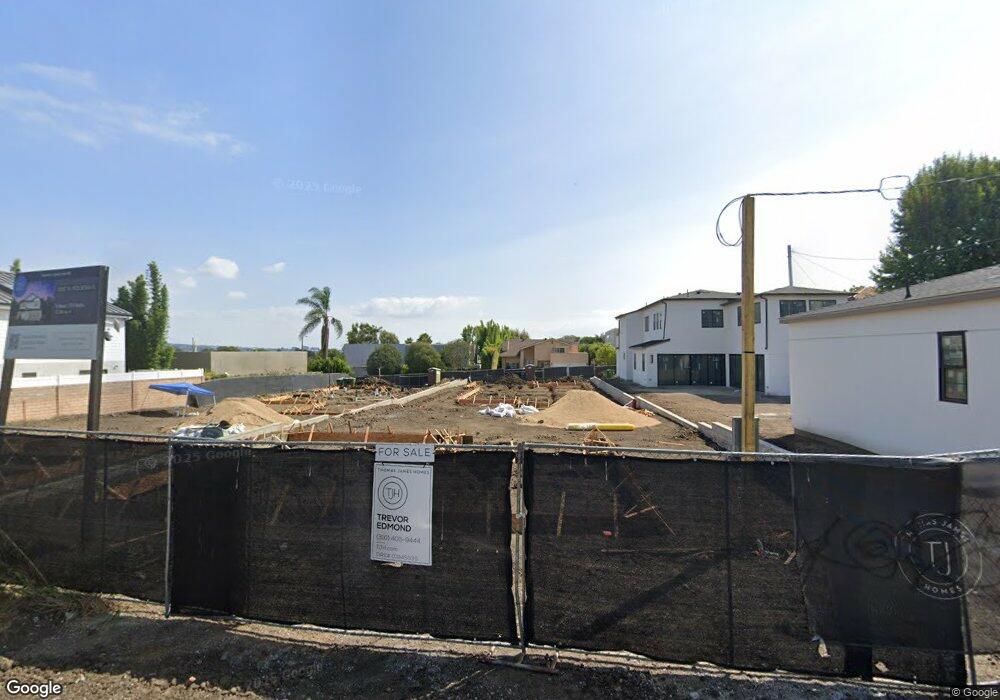
11952 Charnock Rd Los Angeles, CA 90066
Mar Vista NeighborhoodEstimated Value: $2,829,000 - $4,228,000
3
Beds
3
Baths
2,356
Sq Ft
$1,478/Sq Ft
Est. Value
About This Home
This home is located at 11952 Charnock Rd, Los Angeles, CA 90066 and is currently estimated at $3,481,333, approximately $1,477 per square foot. 11952 Charnock Rd is a home located in Los Angeles County with nearby schools including Grand View Boulevard Elementary School, Daniel Webster Middle School, and Venice High School.
Ownership History
Date
Name
Owned For
Owner Type
Purchase Details
Closed on
Jun 18, 2024
Sold by
Tjh Socal Llc
Bought by
La21g Llc
Current Estimated Value
Home Financials for this Owner
Home Financials are based on the most recent Mortgage that was taken out on this home.
Original Mortgage
$3,010,000
Outstanding Balance
$2,972,100
Interest Rate
7.09%
Mortgage Type
Construction
Estimated Equity
$509,233
Purchase Details
Closed on
Mar 21, 2024
Sold by
Wilma R Champlin Survivors Trust and Champlin Brad L
Bought by
Tjh Socal Llc
Home Financials for this Owner
Home Financials are based on the most recent Mortgage that was taken out on this home.
Original Mortgage
$2,600,000
Interest Rate
6.77%
Mortgage Type
New Conventional
Purchase Details
Closed on
Apr 5, 2012
Sold by
Champlin Wilma R and Champlin Family Trust
Bought by
Champlin Wilma R and Wilma R Champlin Survivors Trust
Purchase Details
Closed on
Sep 22, 2006
Sold by
Champlin Loren and Champlin Wilma
Bought by
Champlin Loren
Create a Home Valuation Report for This Property
The Home Valuation Report is an in-depth analysis detailing your home's value as well as a comparison with similar homes in the area
Home Values in the Area
Average Home Value in this Area
Purchase History
| Date | Buyer | Sale Price | Title Company |
|---|---|---|---|
| La21g Llc | -- | Fidelity National Title | |
| Tjh Socal Llc | $3,900,000 | Fidelity National Title | |
| Champlin Wilma R | -- | None Available | |
| Champlin Loren | -- | None Available |
Source: Public Records
Mortgage History
| Date | Status | Borrower | Loan Amount |
|---|---|---|---|
| Open | La21g Llc | $3,010,000 | |
| Previous Owner | Tjh Socal Llc | $2,600,000 |
Source: Public Records
Tax History Compared to Growth
Tax History
| Year | Tax Paid | Tax Assessment Tax Assessment Total Assessment is a certain percentage of the fair market value that is determined by local assessors to be the total taxable value of land and additions on the property. | Land | Improvement |
|---|---|---|---|---|
| 2025 | $2,162 | $2,101,200 | $2,101,200 | -- |
| 2024 | $2,162 | $152,811 | $88,667 | $64,144 |
| 2023 | $2,130 | $149,816 | $86,929 | $62,887 |
| 2022 | $2,045 | $146,879 | $85,225 | $61,654 |
| 2021 | $2,004 | $144,000 | $83,554 | $60,446 |
| 2019 | $1,950 | $139,731 | $81,077 | $58,654 |
| 2018 | $1,842 | $136,992 | $79,488 | $57,504 |
| 2016 | $1,738 | $131,674 | $76,402 | $55,272 |
| 2015 | $1,715 | $129,697 | $75,255 | $54,442 |
| 2014 | $1,731 | $127,157 | $73,781 | $53,376 |
Source: Public Records
Map
Nearby Homes
- 11957 Modjeska Place
- 3613 Inglewood Blvd
- 11702 Charnock Rd
- 3601 Mclaughlin Ave
- 11622 Charnock Rd
- 3524 Grand View Blvd
- 3743 Mclaughlin Ave
- 3617 Ocean View Ave
- 11931 Lawler St
- 11856 Venice Blvd
- 12028 Venice Blvd
- 11523 Vienna Way
- 11419 Charnock Rd
- 3491 Butler Ave
- 3733 S Centinela Ave
- 12413 Westminster Ave
- 3460 S Centinela Ave Unit 505
- 11510 Venice Blvd
- 3833 Coolidge Ave
- 3783 Colonial Ave
- 11971 Modjeska Place
- 11945 Modjeska Place
- 3618 Inglewood Blvd
- 11969 Modjeska Place
- 3612 Inglewood Blvd
- 11942 Charnock Rd
- 3624 Inglewood Blvd
- 3600 Inglewood Blvd
- 11933 Modjeska Place
- 11791 Modjeska Place
- 11953 Charnock Rd
- 11947 Charnock Rd
- 11959 Charnock Rd
- 11932 Charnock Rd
- 11941 Charnock Rd
- 3630 Inglewood Blvd
- 11960 Modjeska Place
- 11948 Modjeska Place
- 3590 Inglewood Blvd
- 11935 Charnock Rd