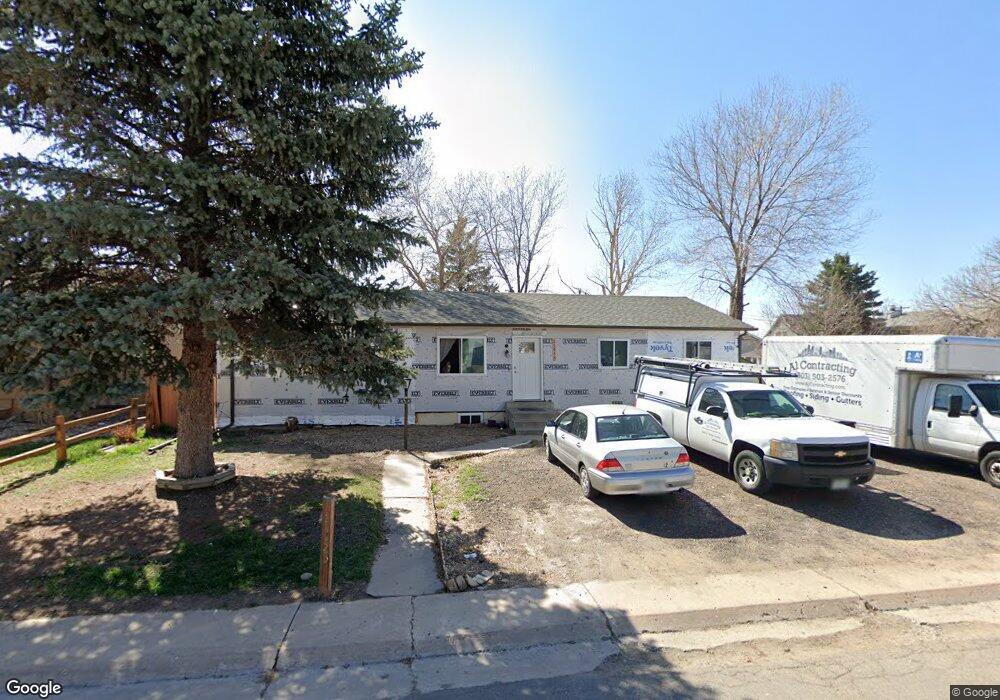
11955 S Clayson St Parker, CO 80138
Estimated Value: $536,000 - $589,560
4
Beds
3
Baths
2,883
Sq Ft
$192/Sq Ft
Est. Value
About This Home
This home is located at 11955 S Clayson St, Parker, CO 80138 and is currently estimated at $554,890, approximately $192 per square foot. 11955 S Clayson St is a home located in Douglas County with nearby schools including Pine Lane Elementary School, Sierra Middle School, and Chaparral High School.
Ownership History
Date
Name
Owned For
Owner Type
Purchase Details
Closed on
Aug 10, 2018
Sold by
Burn Justin M
Bought by
Benninghoven Douglas W
Current Estimated Value
Home Financials for this Owner
Home Financials are based on the most recent Mortgage that was taken out on this home.
Original Mortgage
$315,000
Outstanding Balance
$273,565
Interest Rate
4.5%
Mortgage Type
New Conventional
Estimated Equity
$281,325
Purchase Details
Closed on
Jan 15, 2014
Sold by
Kraser Theresa
Bought by
Burn Justin M
Home Financials for this Owner
Home Financials are based on the most recent Mortgage that was taken out on this home.
Original Mortgage
$168,000
Interest Rate
4.48%
Mortgage Type
New Conventional
Purchase Details
Closed on
Mar 30, 1987
Sold by
Hoffman Thomas P and Hoffman Kim R
Bought by
Kraser Bruce W and Kraser Theresa
Purchase Details
Closed on
Feb 22, 1982
Sold by
Hoos Dale R
Bought by
Hoffman Thomas P and Hoffman Kim R
Create a Home Valuation Report for This Property
The Home Valuation Report is an in-depth analysis detailing your home's value as well as a comparison with similar homes in the area
Home Values in the Area
Average Home Value in this Area
Purchase History
| Date | Buyer | Sale Price | Title Company |
|---|---|---|---|
| Benninghoven Douglas W | $350,000 | Colorado Escrow & Title | |
| Burn Justin M | $214,250 | Fidelity National Title Insu | |
| Kraser Bruce W | $88,400 | -- | |
| Hoffman Thomas P | $65,000 | -- |
Source: Public Records
Mortgage History
| Date | Status | Borrower | Loan Amount |
|---|---|---|---|
| Open | Benninghoven Douglas W | $315,000 | |
| Previous Owner | Burn Justin M | $168,000 |
Source: Public Records
Tax History Compared to Growth
Tax History
| Year | Tax Paid | Tax Assessment Tax Assessment Total Assessment is a certain percentage of the fair market value that is determined by local assessors to be the total taxable value of land and additions on the property. | Land | Improvement |
|---|---|---|---|---|
| 2024 | $3,216 | $39,720 | $9,720 | $30,000 |
| 2023 | $3,253 | $39,720 | $9,720 | $30,000 |
| 2022 | $2,452 | $27,750 | $5,710 | $22,040 |
| 2021 | $2,552 | $27,750 | $5,710 | $22,040 |
| 2020 | $2,625 | $29,030 | $5,460 | $23,570 |
| 2019 | $2,641 | $29,030 | $5,460 | $23,570 |
| 2018 | $2,245 | $24,060 | $5,270 | $18,790 |
| 2017 | $2,086 | $24,060 | $5,270 | $18,790 |
| 2016 | $1,786 | $20,230 | $3,180 | $17,050 |
| 2015 | $1,818 | $20,230 | $3,180 | $17,050 |
| 2014 | $1,568 | $15,590 | $3,180 | $12,410 |
Source: Public Records
Map
Nearby Homes
- 11941 S Clayson St
- 11898 S Clayson St
- 10215 Parkglenn Way
- 6736 Longpark Dr
- 11761 Cord Grass Way
- 11641 Colony Loop
- 11818 Barrentine Loop
- 11865 Barrentine Loop
- 11447 Brownstone Dr
- 12539 N State Highway 83
- 7285 Sagebrush Dr
- 7330 Centennial Dr
- 7390 Sagebrush Dr
- 9538 S Coltsfoot Dr
- 9287 Twenty Mile Rd Unit 406
- 9287 Twenty Mile Rd Unit 204
- 9291 Twenty Mile Rd Unit 408
- 9287 Twenty Mile Rd Unit 401
- 9295 Twenty Mile Rd Unit 8
- 19812 Rosewood Ct
- 11945 S Clayson St
- 11954 Barrett St
- 6525 Alcorn Ave
- 11944 Barrett St
- 6531 Alcorn Ave
- 6505 Alcorn Ave
- 11956 S Clayson St
- 6539 Alcorn Ave
- 11940 Barrett St
- 11946 S Clayson St
- 11917 S Clayson St
- 6495 Alcorn Ave
- 6553 Alcorn Ave
- 11942 S Clayson St
- 11916 Barrett St
- 6485 Alcorn Ave
- 6563 Alcorn Ave
- 11918 S Clayson St
- 6475 Alcorn Ave
- 11906 Barrett St