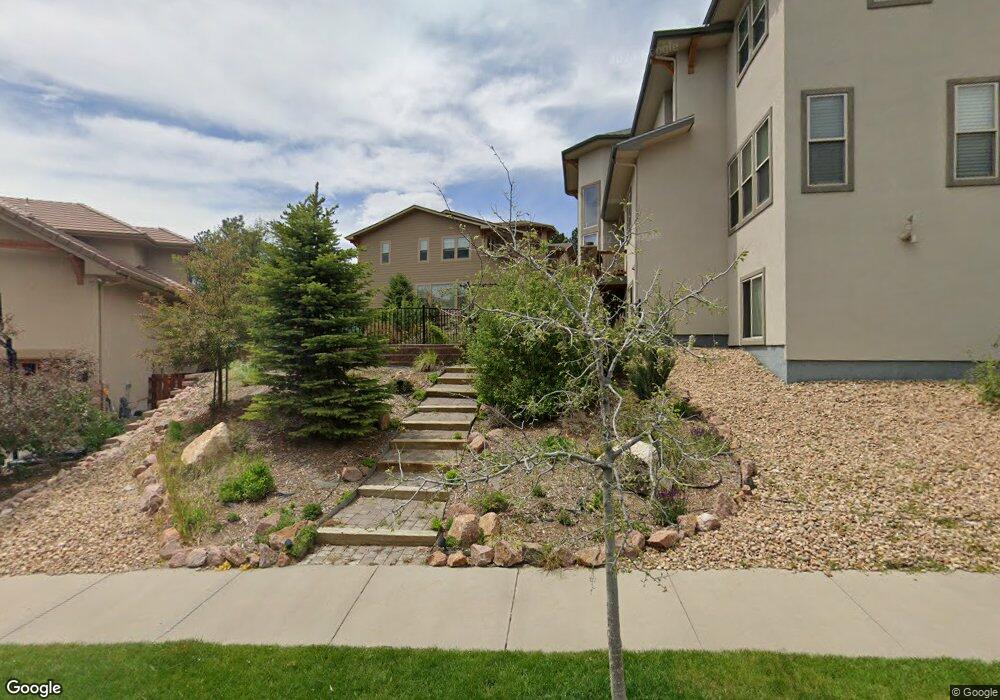
11965 S Longsbluff Ln Parker, CO 80134
Estimated Value: $1,069,715 - $1,286,000
4
Beds
5
Baths
4,602
Sq Ft
$258/Sq Ft
Est. Value
About This Home
This home is located at 11965 S Longsbluff Ln, Parker, CO 80134 and is currently estimated at $1,187,429, approximately $258 per square foot. 11965 S Longsbluff Ln is a home located in Douglas County with nearby schools including Iron Horse Elementary School, Cimarron Middle School, and Legend High School.
Ownership History
Date
Name
Owned For
Owner Type
Purchase Details
Closed on
Apr 11, 2018
Sold by
Manning Dan V and Manning Jenna M
Bought by
Hollenbaugh Gregory S and Hollenbaugh Lauren J
Current Estimated Value
Purchase Details
Closed on
Sep 4, 2008
Sold by
Toll Co Lp
Bought by
Manning Dan V and Manning Jenna M
Home Financials for this Owner
Home Financials are based on the most recent Mortgage that was taken out on this home.
Original Mortgage
$417,000
Interest Rate
6.6%
Mortgage Type
Unknown
Create a Home Valuation Report for This Property
The Home Valuation Report is an in-depth analysis detailing your home's value as well as a comparison with similar homes in the area
Purchase History
| Date | Buyer | Sale Price | Title Company |
|---|---|---|---|
| Hollenbaugh Gregory S | $815,000 | Fidelity National Title | |
| Manning Dan V | $799,923 | Stewart Title Co |
Source: Public Records
Mortgage History
| Date | Status | Borrower | Loan Amount |
|---|---|---|---|
| Previous Owner | Manning Dan V | $417,000 |
Source: Public Records
Tax History
| Year | Tax Paid | Tax Assessment Tax Assessment Total Assessment is a certain percentage of the fair market value that is determined by local assessors to be the total taxable value of land and additions on the property. | Land | Improvement |
|---|---|---|---|---|
| 2025 | $7,451 | $70,700 | $14,320 | $56,380 |
| 2024 | $7,451 | $78,300 | $12,840 | $65,460 |
| 2023 | $7,529 | $78,300 | $12,840 | $65,460 |
| 2022 | $5,694 | $53,490 | $8,500 | $44,990 |
| 2021 | $5,914 | $53,490 | $8,500 | $44,990 |
| 2020 | $5,945 | $54,780 | $10,390 | $44,390 |
| 2019 | $5,975 | $54,780 | $10,390 | $44,390 |
| 2018 | $6,339 | $54,460 | $8,840 | $45,620 |
| 2017 | $6,524 | $54,460 | $8,840 | $45,620 |
| 2016 | $6,788 | $55,920 | $10,070 | $45,850 |
| 2015 | $6,876 | $55,920 | $10,070 | $45,850 |
| 2014 | $7,648 | $57,220 | $10,530 | $46,690 |
Source: Public Records
Map
Nearby Homes
- 19984 E Crooked Pine Cir
- 12094 S Majestic Pine Way
- 20241 Willowbend Ln
- 11852 Meadowood Ln
- 20132 E Shady Ridge Rd
- 20166 E Shady Ridge Rd
- 11915 Meadowood Ln
- 11632 Larkspur Dr
- 20420 Northern Pine Ave
- 20512 Northern Pine Ave
- 12372 S Nate Cir
- 12352 Nate Cir
- 11524 Running Creek Ln
- 20828 Park Hollow Dr
- 20999 Woodside Ln
- 12168 Eastern Pine Ln
- 12472 S Bellisario Creek Ct
- 21132 Hawthorne Ln
- 12473 S Arcaro Creek Ct
- 20197 Aintree Ct
- 11965 S Longs Bluff Ln
- 11957 S Longsbluff Ln
- 11973 S Longs Bluff Ln
- 11981 S Longsbluff Ln
- 19895 E Crooked Pine Cir
- 11949 S Longsbluff Ln
- 11933 S Longs Bluff Ln
- 11978 S Longsbluff Ln
- 11941 S Longs Bluff Ln
- 11950 S Longsbluff Ln
- 19883 E Crooked Pine Cir
- 19896 E Crooked Pine Cir
- 11925 S Longsbluff Ln
- 11927 S Longs Bluff Ln
- 11979 S Longsbluff Way
- 19918 E Crooked Pine Cir
- 11955 S Longs Bluff Way
- 19869 E Crooked Pine Cir
- 19874 E Crooked Pine Cir
- 11931 S Longs Bluff Way
Your Personal Tour Guide
Ask me questions while you tour the home.