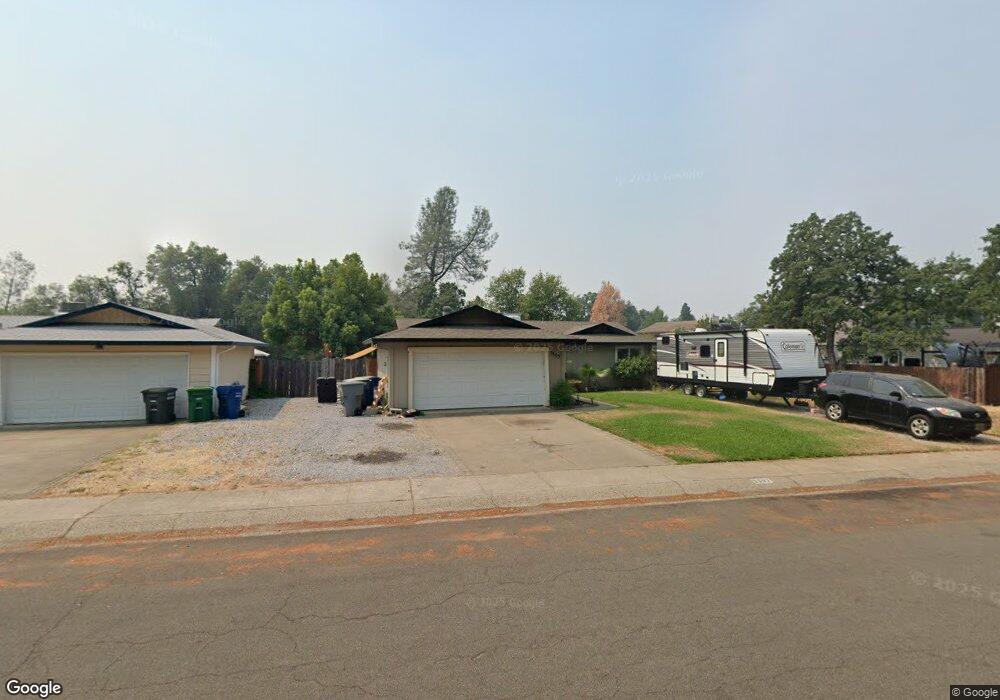
1197 Woodside Meadows Rd Redding, CA 96002
Mistletoe NeighborhoodEstimated Value: $312,000 - $347,000
3
Beds
2
Baths
1,208
Sq Ft
$278/Sq Ft
Est. Value
About This Home
This home is located at 1197 Woodside Meadows Rd, Redding, CA 96002 and is currently estimated at $335,220, approximately $277 per square foot. 1197 Woodside Meadows Rd is a home located in Shasta County with nearby schools including Mistletoe Elementary School, Enterprise High School, and Trinity Lutheran School.
Ownership History
Date
Name
Owned For
Owner Type
Purchase Details
Closed on
Dec 9, 2021
Sold by
Yang Chyna
Bought by
Yang Chong
Current Estimated Value
Home Financials for this Owner
Home Financials are based on the most recent Mortgage that was taken out on this home.
Original Mortgage
$315,250
Outstanding Balance
$290,064
Interest Rate
3.14%
Mortgage Type
New Conventional
Estimated Equity
$45,156
Purchase Details
Closed on
Dec 8, 2021
Sold by
Criss Ladonna M
Bought by
Lee Joua and Yang Hue
Home Financials for this Owner
Home Financials are based on the most recent Mortgage that was taken out on this home.
Original Mortgage
$315,250
Outstanding Balance
$290,064
Interest Rate
3.14%
Mortgage Type
New Conventional
Estimated Equity
$45,156
Purchase Details
Closed on
Dec 6, 2003
Sold by
Criss Michael G
Bought by
Criss Ladonna M
Create a Home Valuation Report for This Property
The Home Valuation Report is an in-depth analysis detailing your home's value as well as a comparison with similar homes in the area
Home Values in the Area
Average Home Value in this Area
Purchase History
| Date | Buyer | Sale Price | Title Company |
|---|---|---|---|
| Yang Chong | -- | Fidelity Natl Ttl Co Of Ca | |
| Lee Joua | $325,000 | Fidelity Natl Ttl Co Of Ca | |
| Criss Ladonna M | -- | -- |
Source: Public Records
Mortgage History
| Date | Status | Borrower | Loan Amount |
|---|---|---|---|
| Open | Yang Chong | $315,250 | |
| Closed | Lee Joua | $315,250 |
Source: Public Records
Tax History
| Year | Tax Paid | Tax Assessment Tax Assessment Total Assessment is a certain percentage of the fair market value that is determined by local assessors to be the total taxable value of land and additions on the property. | Land | Improvement |
|---|---|---|---|---|
| 2025 | $3,664 | $344,892 | $53,060 | $291,832 |
| 2024 | $3,627 | $338,130 | $52,020 | $286,110 |
| 2023 | $3,627 | $331,500 | $51,000 | $280,500 |
| 2022 | $3,585 | $325,000 | $50,000 | $275,000 |
| 2021 | $1,256 | $120,347 | $30,081 | $90,266 |
| 2020 | $1,249 | $119,114 | $29,773 | $89,341 |
| 2019 | $1,237 | $116,780 | $29,190 | $87,590 |
| 2018 | $1,221 | $114,491 | $28,618 | $85,873 |
| 2017 | $1,241 | $112,247 | $28,057 | $84,190 |
| 2016 | $1,160 | $110,047 | $27,507 | $82,540 |
| 2015 | $1,149 | $108,395 | $27,094 | $81,301 |
| 2014 | $1,140 | $106,273 | $26,564 | $79,709 |
Source: Public Records
Map
Nearby Homes
- 1285 Lancers Ln
- 1939 Cameo Ct
- 1110 Grouse Dr
- 1088 Burton Dr
- 1968 Bechelli Ln
- 2093 Victor Ave
- 825 Mission Sierra Ct
- 1026 Palisades Ave
- 856 Mission de Oro Dr
- 1230 Whistling Dr
- 771 Flower Ash Ln
- 1701 E Cypress Ave
- 724 Oakhurst Trail
- 775 Stonebriar Trail
- 720 Stonebriar Trail
- 1556 Minor St
- 2820 Alfreda Way
- 667 Reddington Dr
- 2284 Paris Ave
- 2165 Paris Ave
- 1197 Woodside Meadows Dr
- 1209 Woodside Meadows Dr
- 1189 Woodside Meadows Dr
- 1189 Woodside Meadows Rd
- 1111 Pinewood Ct
- 1217 Woodside Meadows Dr
- 1161 Woodside Meadows Dr
- 40 Acres Woodside Rd
- 1177 Pinewood Ct Unit 1
- 1177 Pinewood Ct
- 1229 Woodside Meadows Rd
- 1229 Woodside Meadows Dr
- 1224 Hawthorne Ave
- 1229 Woodside Meadows Dr
- 1232 Hawthorne Ave
- 1137 Woodside Meadows Dr
- 1137 Woodside Meadows Rd
- 1216 Hawthorne Ave
- 1240 Hawthorne Ave
- 1237 Woodside Meadows Dr
Your Personal Tour Guide
Ask me questions while you tour the home.