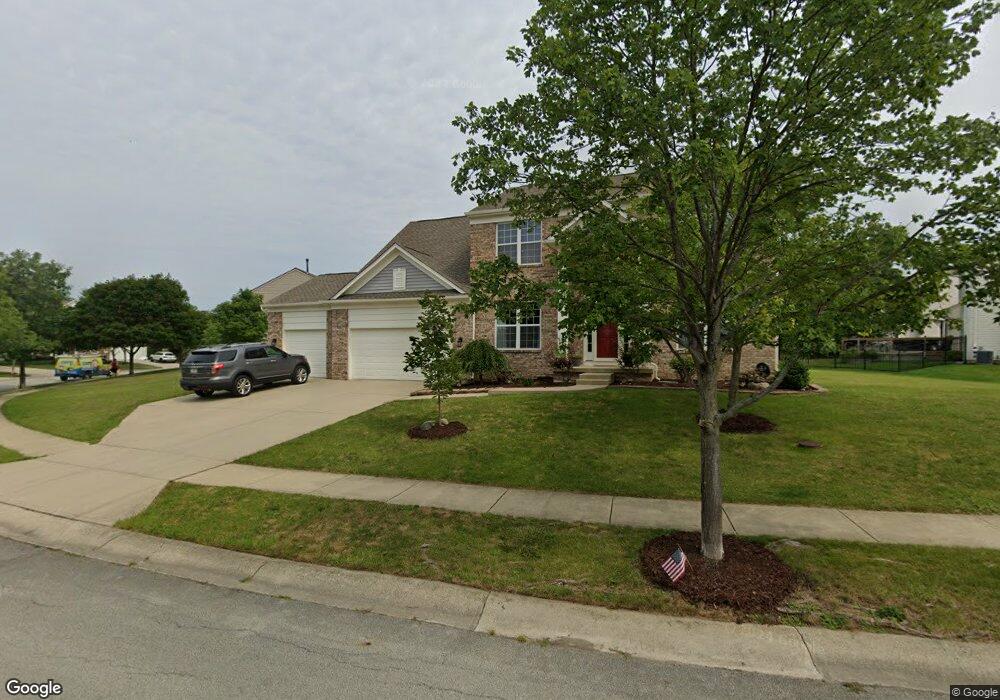
11979 Cabri Ln Fishers, IN 46037
Estimated Value: $446,000 - $479,000
3
Beds
3
Baths
2,298
Sq Ft
$202/Sq Ft
Est. Value
About This Home
This home is located at 11979 Cabri Ln, Fishers, IN 46037 and is currently estimated at $463,613, approximately $201 per square foot. 11979 Cabri Ln is a home located in Hamilton County with nearby schools including Stanton County Elementary School, Hoosier Road Elementary School, and Sand Creek Intermediate School.
Ownership History
Date
Name
Owned For
Owner Type
Purchase Details
Closed on
Mar 13, 2020
Sold by
Lister Amy C and Hill Amy C
Bought by
Hill Nathan E and Hill Amy C
Current Estimated Value
Home Financials for this Owner
Home Financials are based on the most recent Mortgage that was taken out on this home.
Original Mortgage
$227,800
Outstanding Balance
$179,683
Interest Rate
3.4%
Mortgage Type
New Conventional
Estimated Equity
$283,931
Purchase Details
Closed on
Jun 7, 2013
Sold by
Lister Patrick R
Bought by
Lister Amy C
Home Financials for this Owner
Home Financials are based on the most recent Mortgage that was taken out on this home.
Original Mortgage
$221,995
Interest Rate
3.43%
Mortgage Type
New Conventional
Purchase Details
Closed on
Jul 29, 2005
Sold by
Pulte Homes Of Indiana Llc
Bought by
Lister Patrick R and Lister Amy C
Home Financials for this Owner
Home Financials are based on the most recent Mortgage that was taken out on this home.
Original Mortgage
$216,404
Interest Rate
5.71%
Mortgage Type
Fannie Mae Freddie Mac
Create a Home Valuation Report for This Property
The Home Valuation Report is an in-depth analysis detailing your home's value as well as a comparison with similar homes in the area
Home Values in the Area
Average Home Value in this Area
Purchase History
| Date | Buyer | Sale Price | Title Company |
|---|---|---|---|
| Hill Nathan E | -- | Atlantis Title Services Inc | |
| Lister Amy C | -- | None Available | |
| Lister Patrick R | -- | -- |
Source: Public Records
Mortgage History
| Date | Status | Borrower | Loan Amount |
|---|---|---|---|
| Open | Hill Nathan E | $227,800 | |
| Closed | Lister Amy C | $221,995 | |
| Closed | Lister Patrick R | $216,404 |
Source: Public Records
Tax History Compared to Growth
Tax History
| Year | Tax Paid | Tax Assessment Tax Assessment Total Assessment is a certain percentage of the fair market value that is determined by local assessors to be the total taxable value of land and additions on the property. | Land | Improvement |
|---|---|---|---|---|
| 2024 | $4,296 | $403,300 | $87,300 | $316,000 |
| 2023 | $4,296 | $378,400 | $87,300 | $291,100 |
| 2022 | $4,082 | $341,200 | $87,300 | $253,900 |
| 2021 | $3,654 | $306,200 | $87,300 | $218,900 |
| 2020 | $3,669 | $303,500 | $91,000 | $212,500 |
| 2019 | $3,451 | $285,900 | $58,200 | $227,700 |
| 2018 | $3,218 | $266,400 | $58,200 | $208,200 |
| 2017 | $3,260 | $274,000 | $58,200 | $215,800 |
| 2016 | $3,206 | $269,700 | $58,200 | $211,500 |
| 2014 | $2,759 | $255,200 | $58,200 | $197,000 |
| 2013 | $2,759 | $246,300 | $58,200 | $188,100 |
Source: Public Records
Map
Nearby Homes
- 11581 Ludlow Dr
- 12230 Cobblestone Dr
- 11579 Townsend Ct
- 12036 Weathered Edge Dr
- 12307 Chiseled Stone Dr
- 12218 Weathered Edge Dr
- 12337 River Valley Dr
- 11722 Silver Meadow Ct
- 11346 Talnuck Cir
- 12622 Whisper Way
- 12641 Chiefs Ct
- 11318 Talon Trace
- 12438 Berry Patch Ln
- 12430 Hyacinth Dr
- 12635 Touchdown Dr
- 11517 Moss Rock Ct
- 12604 Brooks School Rd
- 12304 Rambling Rd
- 11101 Hawthorn Ridge
- 10798 Sweet Creek Trail
- 12011 Cabri Ln
- 11947 Cabri Ln
- 12019 Cabri Ln
- 11939 Cabri Ln
- 11978 Cabri Ln
- 11986 Cabri Ln
- 11970 Cabri Ln
- 11968 Cabri Ln
- 11994 Cabri Ln
- 11954 Cabri Ln
- 12027 Cabri Ln
- 11946 Cabri Ln
- 11931 Cabri Ln
- 12002 Cabri Ln
- 12010 Cabri Ln
- 11938 Cabri Ln
- 12018 Cabri Ln
- 11516 Rossburn Dr
- 12035 Cabri Ln
- 12026 Cabri Ln