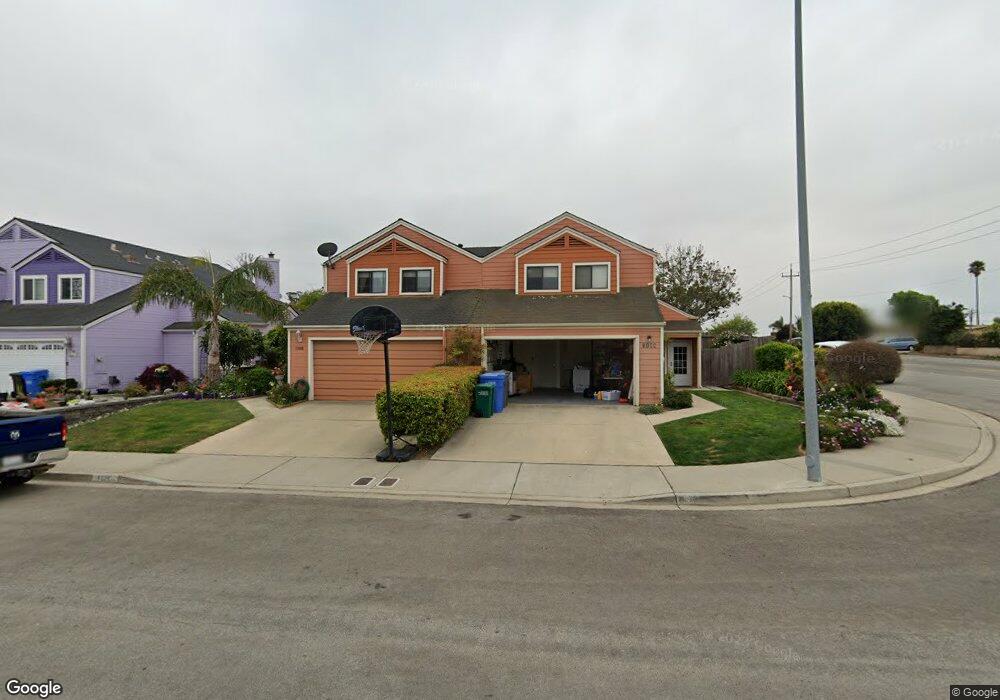
1198 Pacific Pointe Way Arroyo Grande, CA 93420
Estimated Value: $707,231 - $848,000
3
Beds
2
Baths
1,564
Sq Ft
$498/Sq Ft
Est. Value
About This Home
This home is located at 1198 Pacific Pointe Way, Arroyo Grande, CA 93420 and is currently estimated at $778,558, approximately $497 per square foot. 1198 Pacific Pointe Way is a home located in San Luis Obispo County with nearby schools including Fairgrove Elementary School, Paulding Middle School, and Arroyo Grande High School.
Ownership History
Date
Name
Owned For
Owner Type
Purchase Details
Closed on
Aug 12, 2024
Sold by
Cerini Creely Bess Family Trust and Bess Timothy Til
Bought by
Bess Family Trust and Bess-Wedell Living Trust
Current Estimated Value
Purchase Details
Closed on
Jul 15, 2015
Sold by
Bess Cerini C
Bought by
Bess Cerini C
Purchase Details
Closed on
Aug 29, 1995
Sold by
The Bank Of Montecito
Bought by
Bess Cerini C
Home Financials for this Owner
Home Financials are based on the most recent Mortgage that was taken out on this home.
Original Mortgage
$99,600
Interest Rate
7.88%
Purchase Details
Closed on
Oct 24, 1994
Sold by
The Bank Of Montecito and Gordon Kirby K
Bought by
The Bank Of Montecito
Purchase Details
Closed on
Nov 9, 1993
Sold by
Gordon Jill S
Bought by
Gordon Kirby K
Purchase Details
Closed on
Nov 2, 1993
Sold by
T W R Investors Of Arroyo Grande
Bought by
Gordon Kirby K
Create a Home Valuation Report for This Property
The Home Valuation Report is an in-depth analysis detailing your home's value as well as a comparison with similar homes in the area
Home Values in the Area
Average Home Value in this Area
Purchase History
| Date | Buyer | Sale Price | Title Company |
|---|---|---|---|
| Bess Family Trust | -- | None Listed On Document | |
| Bess Cerini C | -- | None Available | |
| Bess Cerini C | $125,000 | Chicago Title Co | |
| The Bank Of Montecito | $90,000 | Chicago Title Company | |
| Gordon Kirby K | -- | Ticor Title Insurance Compan | |
| Gordon Kirby K | -- | Ticor Title Insurance Compan |
Source: Public Records
Mortgage History
| Date | Status | Borrower | Loan Amount |
|---|---|---|---|
| Previous Owner | Bess Cerini C | $99,600 |
Source: Public Records
Tax History Compared to Growth
Tax History
| Year | Tax Paid | Tax Assessment Tax Assessment Total Assessment is a certain percentage of the fair market value that is determined by local assessors to be the total taxable value of land and additions on the property. | Land | Improvement |
|---|---|---|---|---|
| 2025 | $2,139 | $707,472 | $364,140 | $343,332 |
| 2024 | $2,115 | $202,735 | $81,417 | $121,318 |
| 2023 | $2,115 | $198,761 | $79,821 | $118,940 |
| 2022 | $2,083 | $194,864 | $78,256 | $116,608 |
| 2021 | $2,079 | $191,044 | $76,722 | $114,322 |
| 2020 | $2,055 | $189,086 | $75,936 | $113,150 |
| 2019 | $2,040 | $185,380 | $74,448 | $110,932 |
| 2018 | $2,016 | $181,746 | $72,989 | $108,757 |
| 2017 | $1,982 | $178,183 | $71,558 | $106,625 |
| 2016 | $1,873 | $174,690 | $70,155 | $104,535 |
| 2015 | $1,857 | $172,067 | $69,102 | $102,965 |
| 2014 | -- | $168,698 | $67,749 | $100,949 |
Source: Public Records
Map
Nearby Homes
- 1172 Pacific Pointe Way
- 575 Carmella Dr
- 1162 Brittany Ave
- 1059 Rogers Ct
- 711 Paul Place
- 1241 Farroll Ave Unit 58
- 450 Pecan St
- 425 Bakeman Ln
- 1449 Ronald Way
- 1515 Nabal Ct
- 1555 Nabal Ct
- 655 S Halcyon Rd Unit 16
- 655 S Halcyon Rd Unit 7
- 655 S Halcyon Rd Unit 26
- 366 S Halcyon Rd
- 364 S Halcyon Rd
- 358 S Halcyon Rd
- 362 S Halcyon Rd
- 2201 La Verne St
- 662 Woodland Ct
- 1196 Pacific Pointe Way
- 1194 Pacific Pointe Way
- 1192 Pacific Pointe Way
- 590 S Elm St
- 1197 Pacific Pointe Way
- 1195 Pacific Pointe Way
- 1190 Pacific Pointe Way
- 1193 Pacific Pointe Way
- 2599 Lancaster Dr
- 592 Carmella Dr
- 629 Garfield Place
- 1191 Pacific Pointe Way
- 1188 Pacific Pointe Way
- 604 S Elm St
- 588 Carmella Dr
- 149 Po Box
- 1189 Pacific Pointe Way
- 633 Garfield Place
- 1149 Pacific Pointe Way