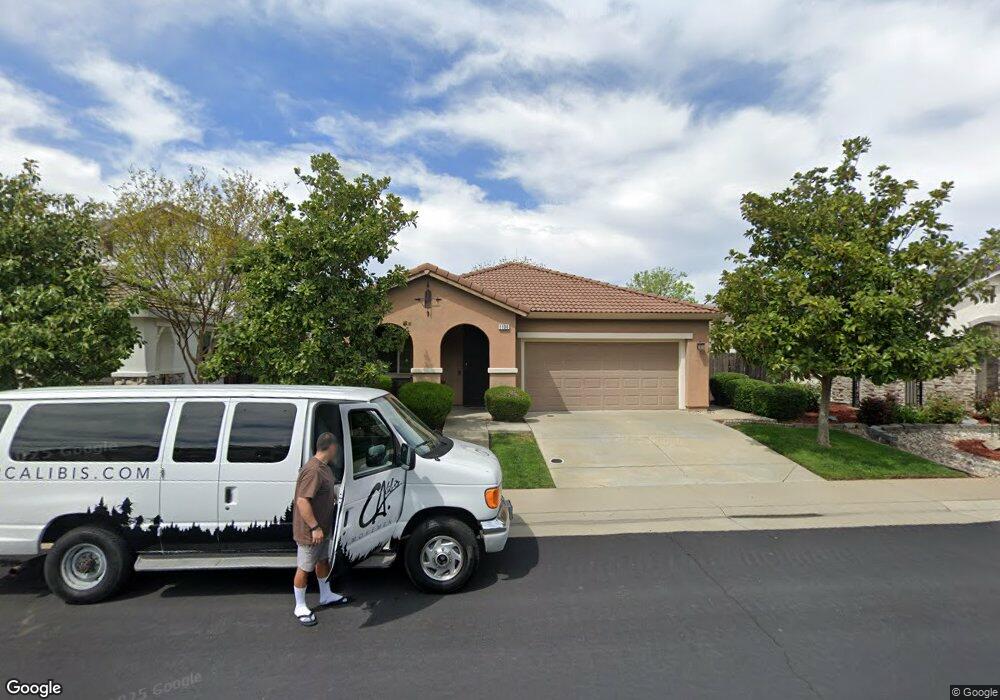
1198 Waverton Ln Lincoln, CA 95648
Estimated Value: $521,000 - $597,000
3
Beds
2
Baths
1,695
Sq Ft
$325/Sq Ft
Est. Value
About This Home
This home is located at 1198 Waverton Ln, Lincoln, CA 95648 and is currently estimated at $550,918, approximately $325 per square foot. 1198 Waverton Ln is a home located in Placer County with nearby schools including Scott M. Leaman, Twelve Bridges Middle School, and John Adams Academy - Lincoln.
Ownership History
Date
Name
Owned For
Owner Type
Purchase Details
Closed on
Mar 10, 2025
Sold by
Wright Kimberly A
Bought by
Kimberly Wright Living Trust and Wright
Current Estimated Value
Purchase Details
Closed on
Aug 27, 2009
Sold by
Parks Valerie and Lamantain Chad
Bought by
Wright Kimberly A
Home Financials for this Owner
Home Financials are based on the most recent Mortgage that was taken out on this home.
Original Mortgage
$216,015
Interest Rate
5.09%
Mortgage Type
FHA
Purchase Details
Closed on
Jul 7, 2006
Sold by
D R Horton Inc Sacramento
Bought by
Parks Valerie and Lamantain Chad
Home Financials for this Owner
Home Financials are based on the most recent Mortgage that was taken out on this home.
Original Mortgage
$290,304
Interest Rate
7.75%
Mortgage Type
Unknown
Create a Home Valuation Report for This Property
The Home Valuation Report is an in-depth analysis detailing your home's value as well as a comparison with similar homes in the area
Home Values in the Area
Average Home Value in this Area
Purchase History
| Date | Buyer | Sale Price | Title Company |
|---|---|---|---|
| Kimberly Wright Living Trust | -- | None Listed On Document | |
| Wright Kimberly A | $220,000 | Chicago Title Company | |
| Parks Valerie | $362,909 | Fidelity National Title Co |
Source: Public Records
Mortgage History
| Date | Status | Borrower | Loan Amount |
|---|---|---|---|
| Previous Owner | Wright Kimberly A | $216,015 | |
| Previous Owner | Parks Valerie | $290,304 |
Source: Public Records
Tax History Compared to Growth
Tax History
| Year | Tax Paid | Tax Assessment Tax Assessment Total Assessment is a certain percentage of the fair market value that is determined by local assessors to be the total taxable value of land and additions on the property. | Land | Improvement |
|---|---|---|---|---|
| 2025 | $5,712 | $293,403 | $45,171 | $248,232 |
| 2023 | $5,712 | $282,012 | $43,418 | $238,594 |
| 2022 | $5,507 | $276,483 | $42,567 | $233,916 |
| 2021 | $5,431 | $271,063 | $41,733 | $229,330 |
| 2020 | $5,393 | $268,285 | $41,306 | $226,979 |
| 2019 | $5,274 | $263,026 | $40,497 | $222,529 |
| 2018 | $5,154 | $257,869 | $39,703 | $218,166 |
| 2017 | $5,378 | $252,814 | $38,925 | $213,889 |
| 2016 | $5,243 | $247,858 | $38,162 | $209,696 |
| 2015 | $5,144 | $244,136 | $37,589 | $206,547 |
| 2014 | $4,946 | $231,655 | $36,853 | $194,802 |
Source: Public Records
Map
Nearby Homes
- 1205 Torrington Ln
- 1345 Seymour Cir
- 1238 Tavistock Ln
- 1325 Underwood Ln
- 1408 Seymour Cir
- 1432 Eaglesfield Ln
- 1166 Ashford Ln
- 1274 Forebridge Ln
- 1678 Lombard Ln
- 1083 Telford St
- 1091 Telford St
- 1075 Telford St
- 1032 Telford St
- 1051 Telford St
- 1043 Telford St
- 1035 Telford St
- 1019 Telford St
- Plan 4 - 1518 at Millau at Twelve Bridges - Millau Collection
- Plan 3 - 2151 at Millau at Twelve Bridges - Millau Collection
- Plan 2 - 1945 at Millau at Twelve Bridges - Millau Collection
- 1192 Waverton Ln
- 1204 Waverton Ln
- 1186 Waverton Ln
- 1210 Waverton Ln
- 1217 Torrington Ln
- 1211 Torrington Ln
- 1177 Waverton Ln
- 1223 Torrington Ln
- 1183 Waverton Ln
- 1171 Waverton Ln
- 1199 Torrington Ln
- 1216 Waverton Ln
- 1189 Waverton Ln
- 1165 Waverton Ln
- 1195 Waverton Ln
- 1229 Torrington Ln
- 1222 Waverton Ln
- 1095 Barnhill Ln
- 1201 Waverton Ln
- 1164 Barnhill Ln