Estimated Value: $493,126 - $541,000
4
Beds
2
Baths
1,846
Sq Ft
$277/Sq Ft
Est. Value
About This Home
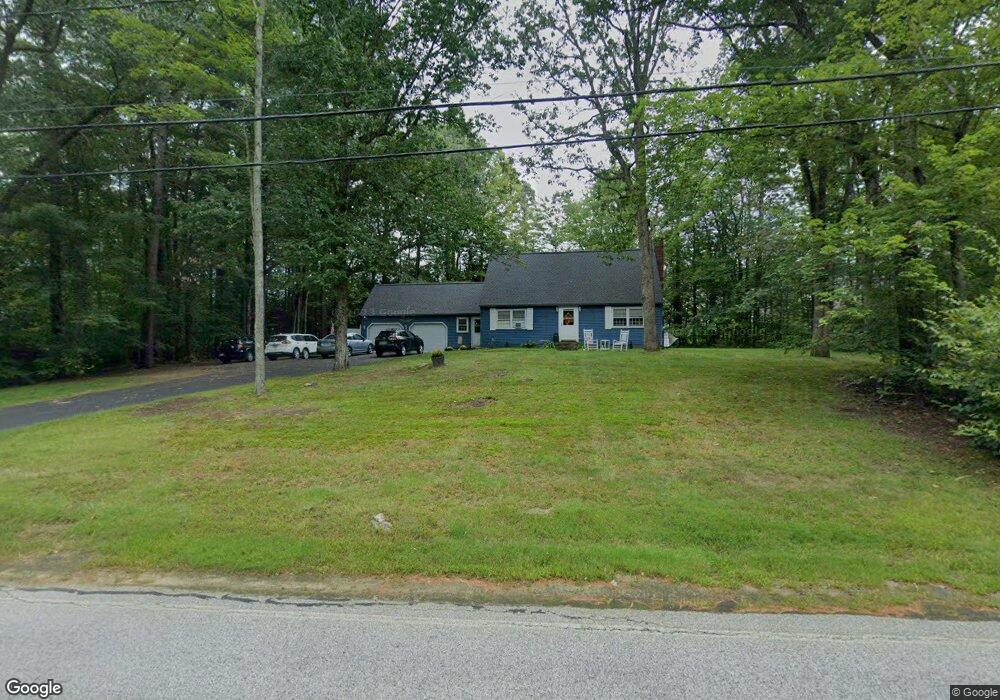
This home is located at 12 Albin Rd, Bow, NH 03304 and is currently estimated at $512,032, approximately $277 per square foot. 12 Albin Rd is a home with nearby schools including Bow Elementary School, Bow Memorial School, and Bow High School.
Ownership History
Date
Name
Owned For
Owner Type
Purchase Details
Closed on
Oct 30, 2024
Sold by
Martin Anne and Remick Lynda
Bought by
Allen Patricia M and Allen-Brewster Donna R
Current Estimated Value
Home Financials for this Owner
Home Financials are based on the most recent Mortgage that was taken out on this home.
Original Mortgage
$255,000
Outstanding Balance
$240,436
Interest Rate
5.15%
Mortgage Type
Stand Alone Refi Refinance Of Original Loan
Estimated Equity
$271,597
Purchase Details
Closed on
Aug 9, 1968
Bought by
Allen Virgil and Allen Pauline
Create a Home Valuation Report for This Property
The Home Valuation Report is an in-depth analysis detailing your home's value as well as a comparison with similar homes in the area
Home Values in the Area
Average Home Value in this Area
Purchase History
| Date | Buyer | Sale Price | Title Company |
|---|---|---|---|
| Allen Patricia M | -- | None Available | |
| Allen Virgil | -- | -- |
Source: Public Records
Mortgage History
| Date | Status | Borrower | Loan Amount |
|---|---|---|---|
| Open | Allen Patricia M | $255,000 |
Source: Public Records
Tax History
| Year | Tax Paid | Tax Assessment Tax Assessment Total Assessment is a certain percentage of the fair market value that is determined by local assessors to be the total taxable value of land and additions on the property. | Land | Improvement |
|---|---|---|---|---|
| 2025 | $7,278 | $363,000 | $133,700 | $229,300 |
| 2024 | $7,180 | $363,000 | $133,700 | $229,300 |
| 2023 | $6,972 | $250,700 | $94,700 | $156,000 |
| 2022 | $6,577 | $248,000 | $94,700 | $153,300 |
| 2021 | $6,322 | $248,000 | $94,700 | $153,300 |
| 2020 | $6,344 | $248,000 | $94,700 | $153,300 |
| 2019 | $6,500 | $248,000 | $94,700 | $153,300 |
| 2018 | $6,031 | $217,100 | $86,400 | $130,700 |
| 2017 | $6,029 | $217,100 | $86,400 | $130,700 |
| 2016 | $5,708 | $217,100 | $86,400 | $130,700 |
| 2015 | $5,468 | $191,600 | $86,400 | $105,200 |
| 2014 | $5,716 | $193,700 | $86,400 | $107,300 |
| 2011 | $5,142 | $189,400 | $86,400 | $103,000 |
Source: Public Records
Map
Nearby Homes
- 5 Holly Cir
- 5 Windchime Dr
- 4 Bow Center Rd Unit F2
- 26 Jonathan Ln
- 77 White Rock Hill Rd
- 289 South St
- 40 Nivelle St
- 107 Page Rd
- 335 S Main St
- 0 South St Unit 4969509
- 24 Hazel Dr
- 30 Longmeadow Dr
- 104 White Rock Hill Rd
- 15 Clearview Dr
- 47 Noyes St
- 47 Bog Rd Unit G2
- 47 South St
- 58 S State St
- 0 Brown Hill Rd Unit 5032600
- 42 Westover Ln
- 9 Albin Rd
- 7 Albin Rd
- 14 Albin Rd
- 11 Albin Rd
- 5 Albin Rd
- 9 Windchime
- 5 Fiddlehead Cir
- 9 Windchime Dr
- 8 Fiddlehead Cir Unit 20
- 10 Windchime Dr Unit 10
- 10 Windchime Dr
- 11 Windchime Dr Unit 11
- 13 Albin Rd
- 0 Windchime Dr
- 1 Holly Cir Unit 1
- 4 Holly Cir Unit 29
- 16 Albin Rd
- 5 Holly Cir Unit 27
- 16 Windchime Dr Unit 10
Your Personal Tour Guide
Ask me questions while you tour the home.