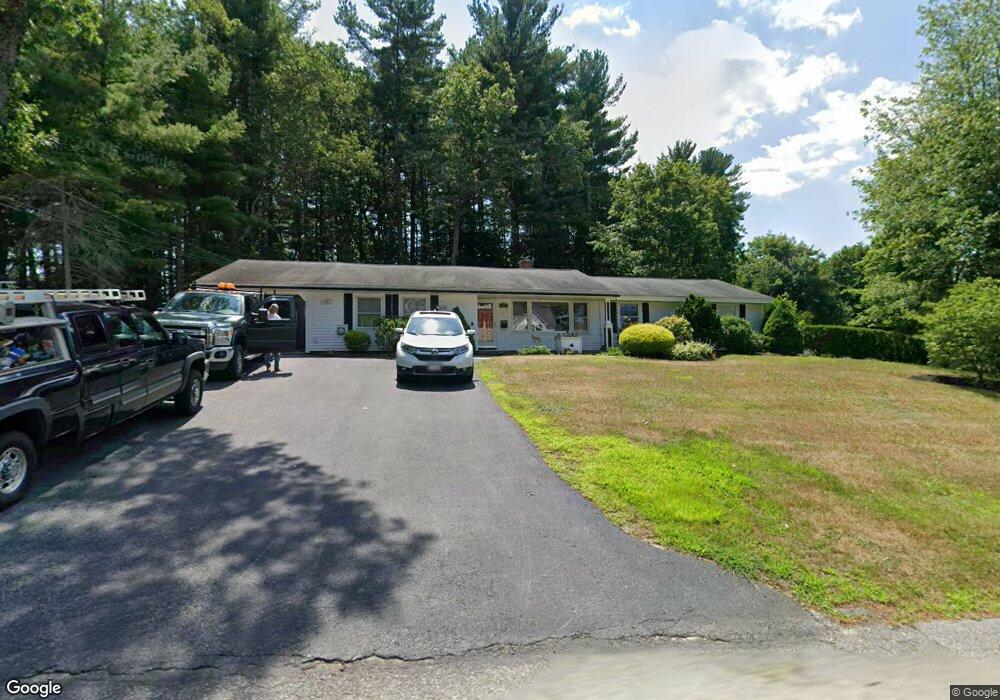
12 Algonquin Rd Chelmsford, MA 01824
Farms I NeighborhoodEstimated Value: $668,000 - $717,197
3
Beds
2
Baths
2,096
Sq Ft
$330/Sq Ft
Est. Value
About This Home
This home is located at 12 Algonquin Rd, Chelmsford, MA 01824 and is currently estimated at $691,799, approximately $330 per square foot. 12 Algonquin Rd is a home located in Middlesex County with nearby schools including South Row Elementary School, McCarthy Middle School, and Knowledge Beginnings South.
Ownership History
Date
Name
Owned For
Owner Type
Purchase Details
Closed on
Oct 7, 2021
Sold by
Mcmahon Valjean
Bought by
Valjean Mcmahon 2021 Ret and Mcmahon
Current Estimated Value
Purchase Details
Closed on
May 23, 1975
Bought by
Mcmahon John J
Create a Home Valuation Report for This Property
The Home Valuation Report is an in-depth analysis detailing your home's value as well as a comparison with similar homes in the area
Home Values in the Area
Average Home Value in this Area
Purchase History
| Date | Buyer | Sale Price | Title Company |
|---|---|---|---|
| Valjean Mcmahon 2021 Ret | -- | None Available | |
| Valjean Mcmahon 2021 Ret | -- | None Available | |
| Mcmahon John J | -- | -- |
Source: Public Records
Tax History Compared to Growth
Tax History
| Year | Tax Paid | Tax Assessment Tax Assessment Total Assessment is a certain percentage of the fair market value that is determined by local assessors to be the total taxable value of land and additions on the property. | Land | Improvement |
|---|---|---|---|---|
| 2025 | $7,621 | $548,300 | $285,900 | $262,400 |
| 2024 | $7,390 | $542,600 | $285,900 | $256,700 |
| 2023 | $7,205 | $501,400 | $307,500 | $193,900 |
| 2022 | $7,060 | $447,700 | $264,000 | $183,700 |
| 2021 | $6,405 | $406,900 | $242,200 | $164,700 |
| 2020 | $6,583 | $400,200 | $207,600 | $192,600 |
| 2019 | $6,339 | $387,700 | $205,600 | $182,100 |
| 2018 | $6,516 | $362,800 | $185,200 | $177,600 |
| 2017 | $6,077 | $339,100 | $173,500 | $165,600 |
| 2016 | $5,860 | $325,000 | $177,400 | $147,600 |
| 2015 | $5,743 | $307,100 | $161,300 | $145,800 |
| 2014 | $5,546 | $292,200 | $152,500 | $139,700 |
Source: Public Records
Map
Nearby Homes
- 9 Donna Rd
- 10 Parlee Rd
- 6 Sierra Dr
- 175 Mill Rd
- 13 Westgate Rd
- 216 Rangeway Rd Unit 192
- Map29-14-1 Rangeway Rd
- 81 Bartlett St
- 11 Simonds Farm Rd
- 12 Martin St
- 66 Acton Rd
- 10 Brook St
- 9 Acton Rd Unit 4
- 9 Acton Rd Unit 6
- 3 Kay's Walk
- 15 Kay's Walk
- 1 Kay's Walk Unit 1
- 1 Kay's Walk
- 13 Kay's Walk
- 15 Kay's Walk Unit 4