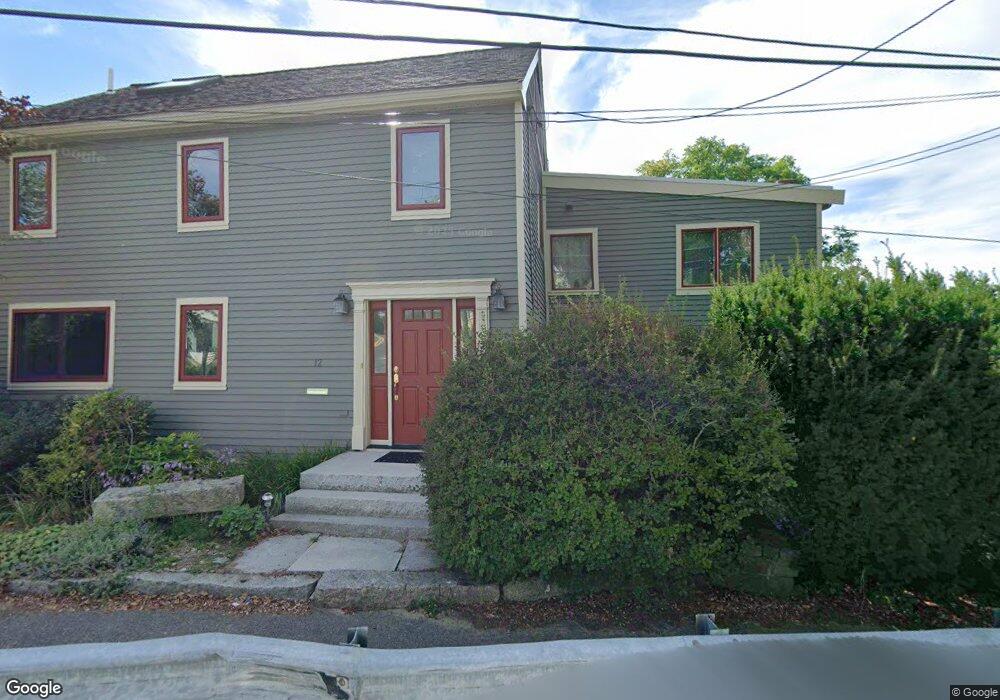
12 Andrews St Gloucester, MA 01930
Estimated Value: $1,019,000 - $1,428,000
4
Beds
6
Baths
2,554
Sq Ft
$492/Sq Ft
Est. Value
About This Home
This home is located at 12 Andrews St, Gloucester, MA 01930 and is currently estimated at $1,257,832, approximately $492 per square foot. 12 Andrews St is a home located in Essex County with nearby schools including Plum Cove School, Ralph B O'maley Middle School, and Gloucester High School.
Ownership History
Date
Name
Owned For
Owner Type
Purchase Details
Closed on
Sep 18, 2024
Sold by
Holland Mary J and Holland Thomas R
Bought by
Holland Mary J
Current Estimated Value
Purchase Details
Closed on
May 6, 2011
Sold by
12 Andrews Street Rt
Bought by
Holland Thomas R and Holland Mary J
Purchase Details
Closed on
Aug 29, 1997
Sold by
Oconnor Kevin K and Vanderschaaf Frederick
Bought by
Howard Catherine A and Trooper David J
Purchase Details
Closed on
Nov 27, 1991
Sold by
Sutherland John E
Bought by
Oconnor Edward K and Clara Oconnor
Purchase Details
Closed on
Jul 16, 1991
Sold by
Sutherland Johne
Bought by
Oconnor Kevin K and Fredrik Vanderschaf
Purchase Details
Closed on
Sep 23, 1987
Sold by
King Mary K
Bought by
Sutherland John E
Create a Home Valuation Report for This Property
The Home Valuation Report is an in-depth analysis detailing your home's value as well as a comparison with similar homes in the area
Purchase History
| Date | Buyer | Sale Price | Title Company |
|---|---|---|---|
| Holland Mary J | -- | None Available | |
| Holland Mary J | -- | None Available | |
| Holland Thomas R | $550,000 | -- | |
| Howard Catherine A | $155,000 | -- | |
| Oconnor Edward K | $160,000 | -- | |
| Oconnor Kevin K | $165,500 | -- | |
| Holland Thomas R | $550,000 | -- | |
| Howard Catherine A | $155,000 | -- | |
| Oconnor Edward K | $160,000 | -- | |
| Oconnor Kevin K | $165,500 | -- | |
| Sutherland John E | $183,000 | -- |
Source: Public Records
Mortgage History
| Date | Status | Borrower | Loan Amount |
|---|---|---|---|
| Previous Owner | Sutherland John E | $245,000 | |
| Previous Owner | Sutherland John E | $93,000 |
Source: Public Records
Tax History
| Year | Tax Paid | Tax Assessment Tax Assessment Total Assessment is a certain percentage of the fair market value that is determined by local assessors to be the total taxable value of land and additions on the property. | Land | Improvement |
|---|---|---|---|---|
| 2025 | $10,314 | $1,061,100 | $334,700 | $726,400 |
| 2024 | $10,169 | $1,045,100 | $318,700 | $726,400 |
| 2023 | $9,708 | $916,700 | $284,600 | $632,100 |
| 2022 | $9,404 | $801,700 | $247,500 | $554,200 |
| 2021 | $9,080 | $729,900 | $225,000 | $504,900 |
| 2020 | $8,940 | $725,100 | $212,100 | $513,000 |
| 2019 | $8,620 | $679,300 | $212,100 | $467,200 |
| 2018 | $8,383 | $648,300 | $212,100 | $436,200 |
| 2017 | $8,122 | $615,800 | $202,000 | $413,800 |
| 2016 | $7,750 | $569,400 | $191,800 | $377,600 |
| 2015 | $7,381 | $540,700 | $191,800 | $348,900 |
Source: Public Records
Map
Nearby Homes
- 43 High St Unit B
- 1030 Washington St
- 10 Emerald St
- 9 Hickory St
- 4 Ciaramitaro Ct
- 136 Leonard St
- 94 Phillips Ave
- 13 Phillips Ave
- 32 Haven Ave
- 33 Quarry Ridge Ln Unit 33
- 5 Boulder Top
- 13 Rowe Point
- 672 Washington St
- 5 Smith St Unit R
- 1 Charte Ct
- 1 Main St Unit R
- 1 Main St Unit C
- 1 Jewett St Unit 2
- 177 Main St
- 226 Atlantic St
- 10 Andrews St
- 7 Lanes Cove Rd
- 20 Andrews St
- 2 Langsford St
- 9 Andrews St
- 4 Langsford St
- 5 Langsford St
- 6 Andrews St
- 22 Andrews St
- 17 Andrews St
- 6 Langsford St
- 6 Langsford St Unit 1
- 6 Langsford St Unit 2
- 6R Langsford St
- 1 Andrews St
- 17 Andrews St
- 7 Langsford St
- 8 Langsford St
- 2 Andrews St
- 1092 Washington St
Your Personal Tour Guide
Ask me questions while you tour the home.