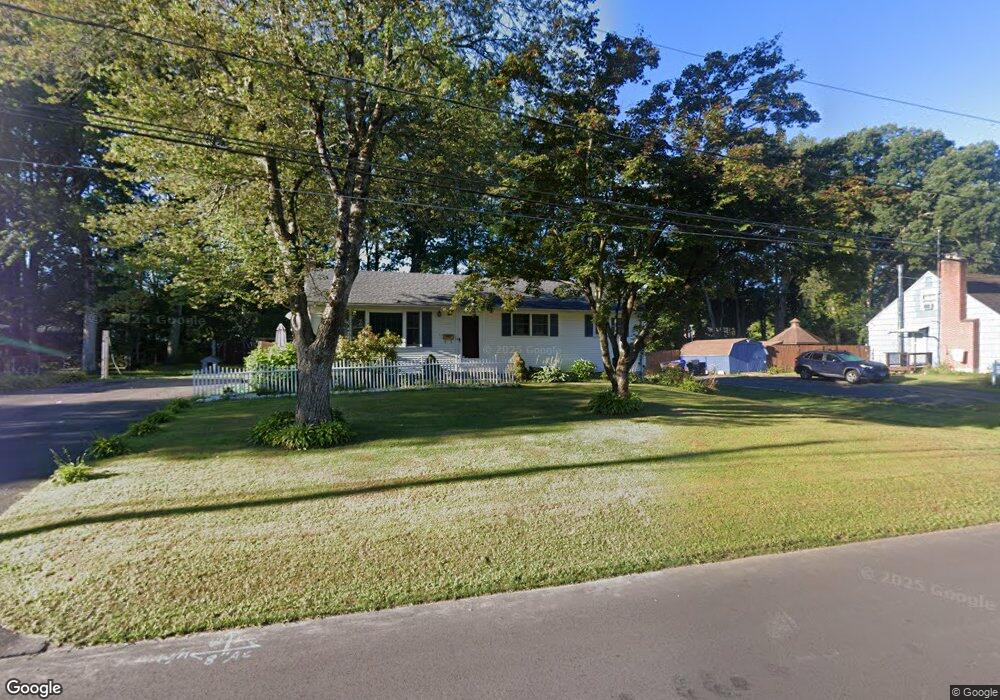
12 Ann St Enfield, CT 06082
Estimated Value: $265,000 - $319,000
3
Beds
1
Bath
1,100
Sq Ft
$267/Sq Ft
Est. Value
About This Home
This home is located at 12 Ann St, Enfield, CT 06082 and is currently estimated at $293,586, approximately $266 per square foot. 12 Ann St is a home located in Hartford County with nearby schools including Edgar H. Parkman School, Enfield Street Elementary School, and Enfield High School.
Ownership History
Date
Name
Owned For
Owner Type
Purchase Details
Closed on
Jan 7, 2011
Sold by
Aurora Loan Serivice L
Bought by
Grivois Brian and Grivois Katie
Current Estimated Value
Home Financials for this Owner
Home Financials are based on the most recent Mortgage that was taken out on this home.
Original Mortgage
$130,593
Outstanding Balance
$84,534
Interest Rate
3.75%
Mortgage Type
FHA
Estimated Equity
$209,052
Purchase Details
Closed on
Nov 2, 2010
Sold by
Perrone Kevin
Bought by
Aurora Loan Services L
Purchase Details
Closed on
Nov 21, 2005
Sold by
Myers Larry and Myers Gail
Bought by
Perrone Kevin
Home Financials for this Owner
Home Financials are based on the most recent Mortgage that was taken out on this home.
Original Mortgage
$148,800
Interest Rate
6.07%
Create a Home Valuation Report for This Property
The Home Valuation Report is an in-depth analysis detailing your home's value as well as a comparison with similar homes in the area
Home Values in the Area
Average Home Value in this Area
Purchase History
| Date | Buyer | Sale Price | Title Company |
|---|---|---|---|
| Grivois Brian | $134,000 | -- | |
| Aurora Loan Services L | -- | -- | |
| Perrone Kevin | $186,000 | -- |
Source: Public Records
Mortgage History
| Date | Status | Borrower | Loan Amount |
|---|---|---|---|
| Open | Perrone Kevin | $130,593 | |
| Closed | Perrone Kevin | $6,100 | |
| Previous Owner | Perrone Kevin | $148,800 | |
| Previous Owner | Perrone Kevin | $37,200 |
Source: Public Records
Tax History
| Year | Tax Paid | Tax Assessment Tax Assessment Total Assessment is a certain percentage of the fair market value that is determined by local assessors to be the total taxable value of land and additions on the property. | Land | Improvement |
|---|---|---|---|---|
| 2025 | $5,224 | $149,300 | $61,700 | $87,600 |
| 2024 | $5,084 | $149,300 | $61,700 | $87,600 |
| 2023 | $5,046 | $149,300 | $61,700 | $87,600 |
| 2022 | $4,582 | $149,300 | $61,700 | $87,600 |
| 2021 | $4,327 | $115,290 | $51,140 | $64,150 |
| 2020 | $4,327 | $115,290 | $51,140 | $64,150 |
| 2019 | $4,338 | $115,290 | $51,140 | $64,150 |
| 2018 | $4,266 | $115,290 | $51,140 | $64,150 |
| 2017 | $4,027 | $115,290 | $51,140 | $64,150 |
| 2016 | $3,951 | $115,150 | $52,480 | $62,670 |
| 2015 | $3,828 | $115,150 | $52,480 | $62,670 |
| 2014 | $3,729 | $115,150 | $52,480 | $62,670 |
Source: Public Records
Map
Nearby Homes
Your Personal Tour Guide
Ask me questions while you tour the home.