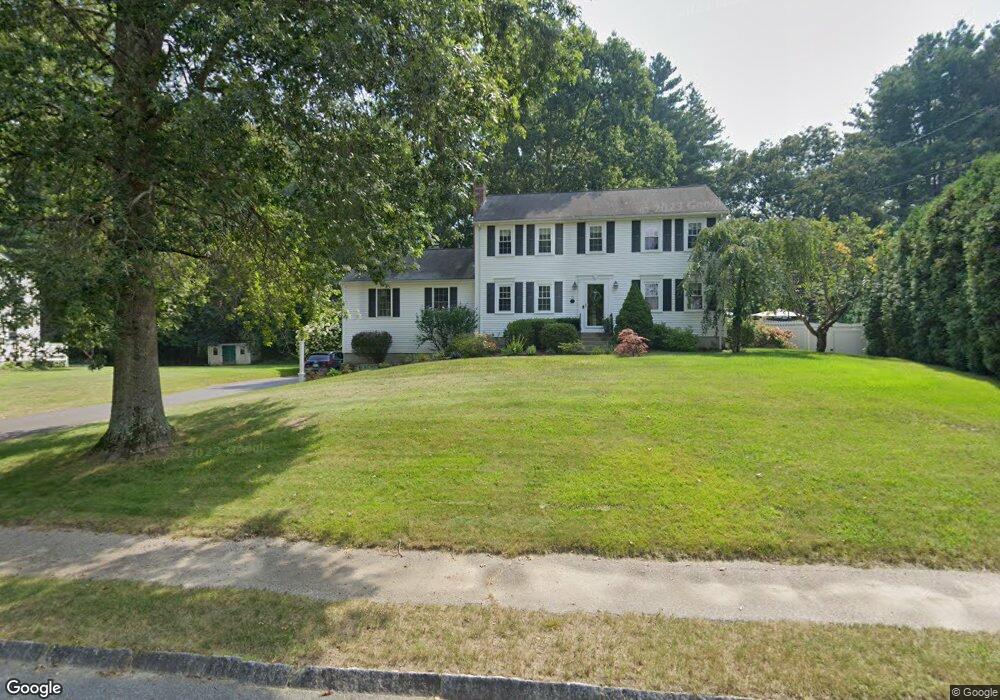
12 Annabel Ln Franklin, MA 02038
Estimated Value: $752,060 - $902,000
4
Beds
2
Baths
2,256
Sq Ft
$361/Sq Ft
Est. Value
About This Home
This home is located at 12 Annabel Ln, Franklin, MA 02038 and is currently estimated at $813,515, approximately $360 per square foot. 12 Annabel Ln is a home located in Norfolk County with nearby schools including John F. Kennedy Memorial School, Horace Mann Middle School, and Franklin High School.
Ownership History
Date
Name
Owned For
Owner Type
Purchase Details
Closed on
May 21, 2019
Sold by
Socci David P and Socci Susan C
Bought by
Socci Ft
Current Estimated Value
Create a Home Valuation Report for This Property
The Home Valuation Report is an in-depth analysis detailing your home's value as well as a comparison with similar homes in the area
Home Values in the Area
Average Home Value in this Area
Purchase History
| Date | Buyer | Sale Price | Title Company |
|---|---|---|---|
| Socci Ft | -- | -- |
Source: Public Records
Tax History Compared to Growth
Tax History
| Year | Tax Paid | Tax Assessment Tax Assessment Total Assessment is a certain percentage of the fair market value that is determined by local assessors to be the total taxable value of land and additions on the property. | Land | Improvement |
|---|---|---|---|---|
| 2025 | $7,633 | $656,900 | $243,800 | $413,100 |
| 2024 | $6,641 | $563,300 | $243,800 | $319,500 |
| 2023 | $6,755 | $537,000 | $245,800 | $291,200 |
| 2022 | $6,460 | $459,800 | $203,100 | $256,700 |
| 2021 | $6,097 | $416,200 | $217,600 | $198,600 |
| 2020 | $5,926 | $408,400 | $219,500 | $188,900 |
| 2019 | $5,684 | $387,700 | $198,800 | $188,900 |
| 2018 | $5,479 | $374,000 | $204,500 | $169,500 |
| 2017 | $5,207 | $357,100 | $187,600 | $169,500 |
| 2016 | $4,802 | $331,200 | $184,500 | $146,700 |
| 2015 | $4,848 | $326,700 | $180,000 | $146,700 |
| 2014 | $4,305 | $297,900 | $151,200 | $146,700 |
Source: Public Records
Map
Nearby Homes
- 60 Southgate Rd
- 951 Pond St
- 2 Noanet Brook Ln
- 18 Mary Anne Dr
- 14 Hawthorne Village Unit D
- 17 Pine St
- 41 Kimberlee Ave
- 21 Riverside Rd
- 0 Elm St
- 208 Irondequoit Rd
- 336 Maple St
- 7 Gloucester Dr
- 455 Hartford Ave
- 2 Kayla Dr
- 732 Lincoln St
- 387 Hartford Ave
- 462 Hartford Ave
- 214 Conlyn Ave
- 4 Shaw St
- 2 Skyline Dr