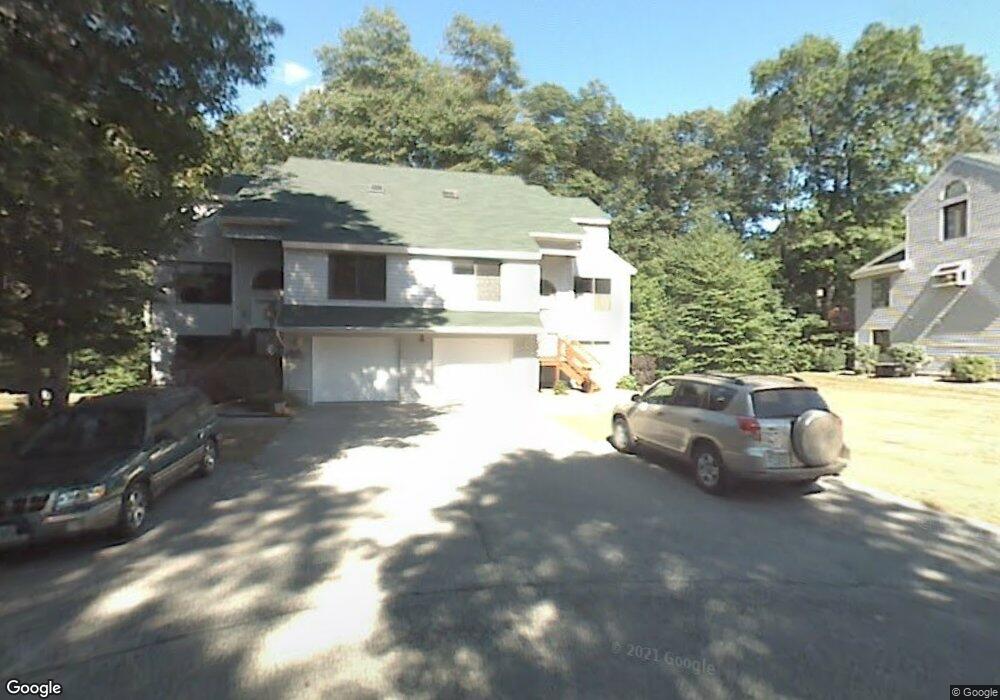
12 Balsam Ct Atkinson, NH 03811
Estimated Value: $465,000 - $519,000
2
Beds
3
Baths
2,482
Sq Ft
$201/Sq Ft
Est. Value
About This Home
This home is located at 12 Balsam Ct, Atkinson, NH 03811 and is currently estimated at $499,257, approximately $201 per square foot. 12 Balsam Ct is a home located in Rockingham County with nearby schools including Atkinson Academy, Timberlane Regional Middle School, and Timberlane Regional High School.
Ownership History
Date
Name
Owned For
Owner Type
Purchase Details
Closed on
Jul 17, 2023
Sold by
Duggan Nanci C and Duggan Francis M
Bought by
Duggan Ft and Caron
Current Estimated Value
Purchase Details
Closed on
Aug 31, 1999
Sold by
Makris Louis J and Makris Margaret S
Bought by
Snow Robin J
Home Financials for this Owner
Home Financials are based on the most recent Mortgage that was taken out on this home.
Original Mortgage
$135,000
Interest Rate
7.53%
Mortgage Type
Purchase Money Mortgage
Create a Home Valuation Report for This Property
The Home Valuation Report is an in-depth analysis detailing your home's value as well as a comparison with similar homes in the area
Home Values in the Area
Average Home Value in this Area
Purchase History
| Date | Buyer | Sale Price | Title Company |
|---|---|---|---|
| Duggan Ft | -- | None Available | |
| Snow Robin J | $190,000 | -- |
Source: Public Records
Mortgage History
| Date | Status | Borrower | Loan Amount |
|---|---|---|---|
| Previous Owner | Snow Robin J | $145,079 | |
| Previous Owner | Snow Robin J | $135,000 |
Source: Public Records
Tax History Compared to Growth
Tax History
| Year | Tax Paid | Tax Assessment Tax Assessment Total Assessment is a certain percentage of the fair market value that is determined by local assessors to be the total taxable value of land and additions on the property. | Land | Improvement |
|---|---|---|---|---|
| 2024 | $5,027 | $389,100 | $0 | $389,100 |
| 2023 | $5,642 | $389,100 | $0 | $389,100 |
| 2022 | $4,774 | $389,100 | $0 | $389,100 |
| 2021 | $4,809 | $389,100 | $0 | $389,100 |
| 2020 | $4,899 | $267,100 | $0 | $267,100 |
| 2019 | $4,720 | $267,100 | $0 | $267,100 |
| 2018 | $4,789 | $267,100 | $0 | $267,100 |
| 2017 | $4,888 | $267,100 | $0 | $267,100 |
| 2016 | $4,776 | $267,100 | $0 | $267,100 |
| 2015 | $4,124 | $215,900 | $0 | $215,900 |
| 2014 | $4,124 | $215,900 | $0 | $215,900 |
| 2013 | $4,102 | $215,900 | $0 | $215,900 |
Source: Public Records
Map
Nearby Homes
- 5 Balsam Ct
- 2 Devonshire Rd
- 54 Westville Rd Unit 12
- 48 Westville Rd Unit 2-5
- 28 Westville Rd
- 5 Whiton Place
- 52 Academy Ave
- 207 Oak Ridge Rd
- 13 Cottonwood Rd
- 34 Bel's Way
- 3 W Pine St Unit 4
- 1 Elm St
- 193 Main St
- 7 Middle Rd Unit B
- 11 Sleepy Hollow Rd
- 42 Plaistow Rd
- 1131 N Broadway
- 2 Major Ln
- 2 N Broadway
- 0 Plaistow Rd Unit 73184617