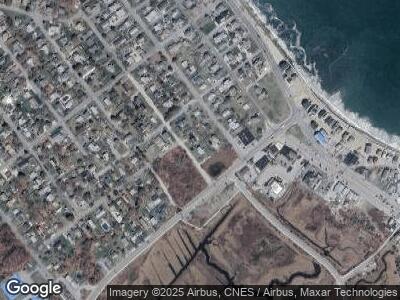
12 Bradley St Marshfield, MA 02050
Ocean Bluff-Brant Rock NeighborhoodEstimated Value: $746,000 - $908,000
3
Beds
2
Baths
1,608
Sq Ft
$503/Sq Ft
Est. Value
About This Home
This home is located at 12 Bradley St, Marshfield, MA 02050 and is currently estimated at $808,911, approximately $503 per square foot. 12 Bradley St is a home located in Plymouth County with nearby schools including Governor Edward Winslow School, Furnace Brook Middle School, and Marshfield High School.
Ownership History
Date
Name
Owned For
Owner Type
Purchase Details
Closed on
Feb 4, 2025
Sold by
Olsen Robert B and Olsen Mary A
Bought by
Olsen Robert B and Olsen Mary A
Current Estimated Value
Purchase Details
Closed on
Nov 23, 1998
Sold by
Toomey Elaine M and Toomey Daniel J
Bought by
Olsen Robert N and Olsen Mary A
Purchase Details
Closed on
Mar 31, 1987
Sold by
Sjw Rt
Bought by
Toomey Daniel J
Create a Home Valuation Report for This Property
The Home Valuation Report is an in-depth analysis detailing your home's value as well as a comparison with similar homes in the area
Home Values in the Area
Average Home Value in this Area
Purchase History
| Date | Buyer | Sale Price | Title Company |
|---|---|---|---|
| Olsen Robert B | -- | None Available | |
| Olsen Robert B | -- | None Available | |
| Olsen Robert N | $204,000 | -- | |
| Olsen Robert N | $204,000 | -- | |
| Toomey Daniel J | $190,000 | -- |
Source: Public Records
Mortgage History
| Date | Status | Borrower | Loan Amount |
|---|---|---|---|
| Previous Owner | Olsen Robert B | $16,900 | |
| Previous Owner | Sjw Realty Tr | $159,000 | |
| Previous Owner | Sjw Realty Tr | $55,000 |
Source: Public Records
Tax History Compared to Growth
Tax History
| Year | Tax Paid | Tax Assessment Tax Assessment Total Assessment is a certain percentage of the fair market value that is determined by local assessors to be the total taxable value of land and additions on the property. | Land | Improvement |
|---|---|---|---|---|
| 2025 | $7,203 | $727,600 | $381,900 | $345,700 |
| 2024 | $7,012 | $674,900 | $361,800 | $313,100 |
| 2023 | $6,238 | $585,100 | $313,600 | $271,500 |
| 2022 | $6,238 | $481,700 | $251,300 | $230,400 |
| 2021 | $6,023 | $456,600 | $251,300 | $205,300 |
| 2020 | $6,086 | $456,600 | $251,300 | $205,300 |
| 2019 | $5,927 | $443,000 | $251,300 | $191,700 |
| 2018 | $5,257 | $393,200 | $211,100 | $182,100 |
| 2017 | $5,155 | $375,700 | $211,100 | $164,600 |
| 2016 | $5,106 | $367,900 | $211,100 | $156,800 |
| 2015 | $4,771 | $359,000 | $201,000 | $158,000 |
| 2014 | $4,804 | $361,500 | $211,100 | $150,400 |
Source: Public Records
Map
Nearby Homes