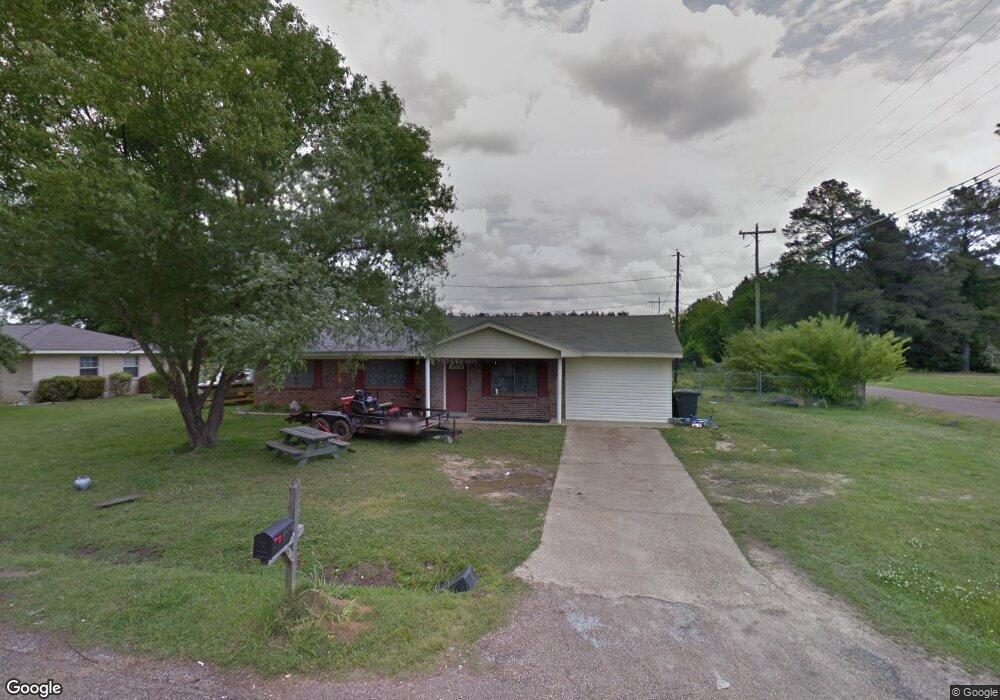
12 Bryant Rd Columbus, MS 39702
Estimated Value: $147,710 - $186,000
Studio
--
Bath
1,487
Sq Ft
$112/Sq Ft
Est. Value
About This Home
This home is located at 12 Bryant Rd, Columbus, MS 39702 and is currently estimated at $166,428, approximately $111 per square foot. 12 Bryant Rd is a home.
Ownership History
Date
Name
Owned For
Owner Type
Purchase Details
Closed on
Jul 29, 2019
Sold by
Adkinsson Brett and Adkinsson Melinda
Bought by
Murphy Brittany N
Current Estimated Value
Home Financials for this Owner
Home Financials are based on the most recent Mortgage that was taken out on this home.
Original Mortgage
$102,605
Outstanding Balance
$89,668
Interest Rate
3.7%
Mortgage Type
New Conventional
Estimated Equity
$76,760
Purchase Details
Closed on
Dec 19, 2014
Sold by
Ferguson William D
Bought by
Newell Melinda K
Home Financials for this Owner
Home Financials are based on the most recent Mortgage that was taken out on this home.
Original Mortgage
$93,100
Interest Rate
4.03%
Mortgage Type
New Conventional
Purchase Details
Closed on
Apr 1, 2014
Sold by
James James and Butler Penny
Bought by
Ferguson William D
Purchase Details
Closed on
Nov 29, 2011
Sold by
Speed Donald S
Bought by
Butler James and Butler Penny
Create a Home Valuation Report for This Property
The Home Valuation Report is an in-depth analysis detailing your home's value as well as a comparison with similar homes in the area
Purchase History
| Date | Buyer | Sale Price | Title Company |
|---|---|---|---|
| Murphy Brittany N | -- | -- | |
| Newell Melinda K | -- | None Available | |
| Ferguson William D | -- | -- | |
| Butler James | -- | -- |
Source: Public Records
Mortgage History
| Date | Status | Borrower | Loan Amount |
|---|---|---|---|
| Open | Murphy Brittany N | $102,605 | |
| Previous Owner | Newell Melinda K | $93,100 |
Source: Public Records
Tax History
| Year | Tax Paid | Tax Assessment Tax Assessment Total Assessment is a certain percentage of the fair market value that is determined by local assessors to be the total taxable value of land and additions on the property. | Land | Improvement |
|---|---|---|---|---|
| 2025 | $380 | $6,582 | $0 | $0 |
| 2024 | $375 | $6,582 | $0 | $0 |
| 2023 | $359 | $6,382 | $0 | $0 |
| 2022 | $359 | $6,382 | $0 | $0 |
| 2021 | $336 | $6,382 | $0 | $0 |
| 2020 | $304 | $6,382 | $0 | $0 |
| 2019 | $317 | $9,434 | $0 | $0 |
| 2018 | $317 | $6,341 | $0 | $0 |
| 2017 | $292 | $6,341 | $0 | $0 |
| 2016 | $292 | $6,341 | $0 | $0 |
| 2015 | $283 | $6,101 | $0 | $0 |
| 2014 | $554 | $6,390 | $0 | $0 |
Source: Public Records
Map
Nearby Homes
- 1553 Hildreth Rd
- 479 Bryant Rd
- 611 Thornton Dr
- 91 Wilson Dr
- 76 Richardson Rd
- 274 Hughes Rd
- 346 Williams Place
- 59 Savannah St
- 9 Monticello Cir
- 836 Oswalt Rd
- 164 Sleepy Fawn Park
- 805 Timber Creek Dr
- 800 Hairston Bend Rd
- 178 Rogers Way
- 262 Center Rd
- 304 Timber Creek Dr
- 17 Paige Cove
- 16 Jenny Ln
- 0 E Minnie Vaughn Rd
- 2654 Yorkville Rd E
- 38 Bryant Rd
- 1150 Hildreth Rd
- 1145 Hildreth Rd
- 56 Bryant Rd
- 1103 Hildreth Rd
- 1183 Hildreth Rd
- 68 Bryant Rd
- 1194 Hildreth Rd
- 86 Bryant Rd
- 1195 Hildreth Rd
- 104 Bryant Rd
- 1219 Hildreth Rd
- 1060 Hildreth Rd
- 1014 Hildreth Rd
- 51 Gerry Dr
- 1254 Hildreth Rd
- 79 Gerry Dr
- 1017 Hildreth Rd
- 97 Gerry Dr
- 133 Bryant Rd
Your Personal Tour Guide
Ask me questions while you tour the home.