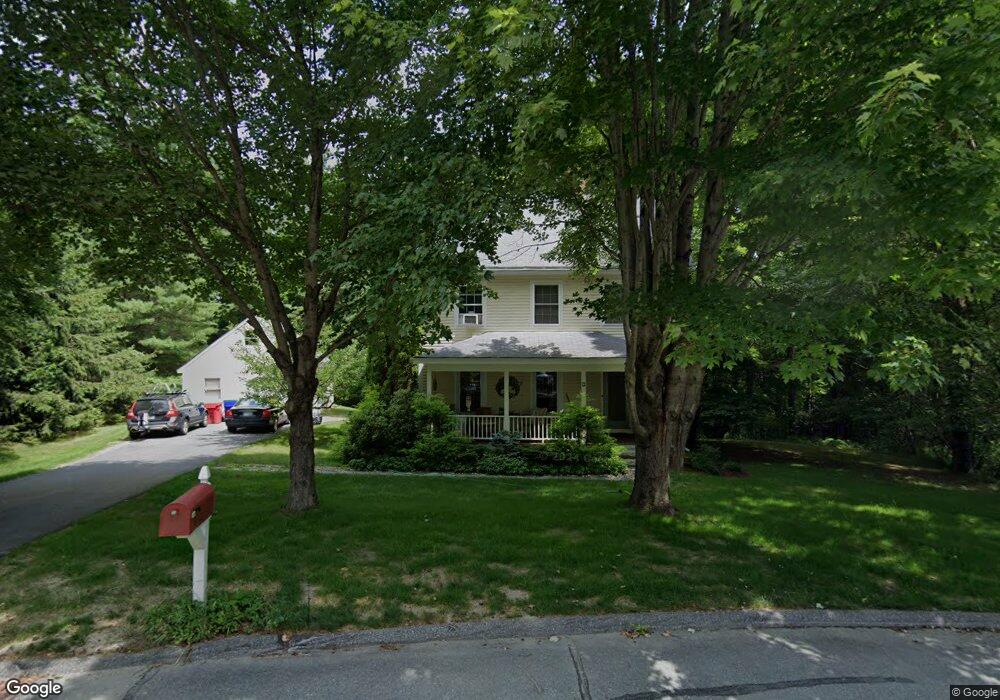
12 Chambers Cir West Lebanon, NH 03784
Estimated Value: $728,000 - $1,083,000
4
Beds
4
Baths
2,464
Sq Ft
$346/Sq Ft
Est. Value
About This Home
This home is located at 12 Chambers Cir, West Lebanon, NH 03784 and is currently estimated at $853,671, approximately $346 per square foot. 12 Chambers Cir is a home located in Grafton County with nearby schools including Mt. Lebanon School, Lebanon Middle School, and Lebanon High School.
Ownership History
Date
Name
Owned For
Owner Type
Purchase Details
Closed on
Jun 23, 2009
Sold by
Becker Troy J and Moon Danielle
Bought by
Landon-Hall Elizabeth and Landon-Hall Douglas Geoffrey
Current Estimated Value
Home Financials for this Owner
Home Financials are based on the most recent Mortgage that was taken out on this home.
Original Mortgage
$140,000
Outstanding Balance
$89,120
Interest Rate
4.91%
Mortgage Type
Purchase Money Mortgage
Estimated Equity
$764,551
Purchase Details
Closed on
Jun 28, 2007
Sold by
Karp Jordan D and Karp Meredith
Bought by
Becker Troy J
Home Financials for this Owner
Home Financials are based on the most recent Mortgage that was taken out on this home.
Original Mortgage
$330,000
Interest Rate
6.24%
Mortgage Type
Purchase Money Mortgage
Purchase Details
Closed on
Jan 30, 2001
Sold by
Snider William C and Snider Ruth C
Bought by
Chapman M Weston and Chapman Martha B
Create a Home Valuation Report for This Property
The Home Valuation Report is an in-depth analysis detailing your home's value as well as a comparison with similar homes in the area
Home Values in the Area
Average Home Value in this Area
Purchase History
| Date | Buyer | Sale Price | Title Company |
|---|---|---|---|
| Landon-Hall Elizabeth | $441,300 | -- | |
| Becker Troy J | $485,000 | -- | |
| Chapman M Weston | $265,000 | -- |
Source: Public Records
Mortgage History
| Date | Status | Borrower | Loan Amount |
|---|---|---|---|
| Open | Chapman M Weston | $140,000 | |
| Previous Owner | Chapman M Weston | $330,000 | |
| Previous Owner | Chapman M Weston | $319,200 |
Source: Public Records
Tax History Compared to Growth
Tax History
| Year | Tax Paid | Tax Assessment Tax Assessment Total Assessment is a certain percentage of the fair market value that is determined by local assessors to be the total taxable value of land and additions on the property. | Land | Improvement |
|---|---|---|---|---|
| 2024 | $14,149 | $538,400 | $144,400 | $394,000 |
| 2023 | $13,072 | $538,400 | $144,400 | $394,000 |
| 2022 | $12,409 | $538,600 | $144,600 | $394,000 |
| 2021 | $12,605 | $467,200 | $138,000 | $329,200 |
| 2019 | $11,905 | $392,000 | $110,400 | $281,600 |
| 2018 | $11,650 | $392,000 | $110,400 | $281,600 |
| 2017 | $1,209 | $392,000 | $110,400 | $281,600 |
| 2016 | $0 | $392,000 | $110,400 | $281,600 |
| 2015 | $10,823 | $392,000 | $110,400 | $281,600 |
| 2014 | $10,151 | $386,400 | $110,400 | $276,000 |
| 2013 | $10,186 | $399,300 | $123,300 | $276,000 |
Source: Public Records
Map
Nearby Homes
- 5 E Wilder Rd
- 2 Brockway Rd
- 9 Walnut St
- 85 Lebanon St
- 13 Hawthorn St
- 2577 Hartford Ave
- 1668 Hartford Ave
- 68 Passumpsic Ave
- 78 Division St
- 99 Depot St
- 61 Depot St
- 33 E Wheelock St
- 36 Juniper Dr Unit 6B
- 46A Barrister Dr Unit 205
- 0 Barrister Dr Unit 3
- 37 Low Rd
- 5 College Hill
- 1 Depot St
- 55 Horseshoe Ave
- 86 Woodhaven Dr