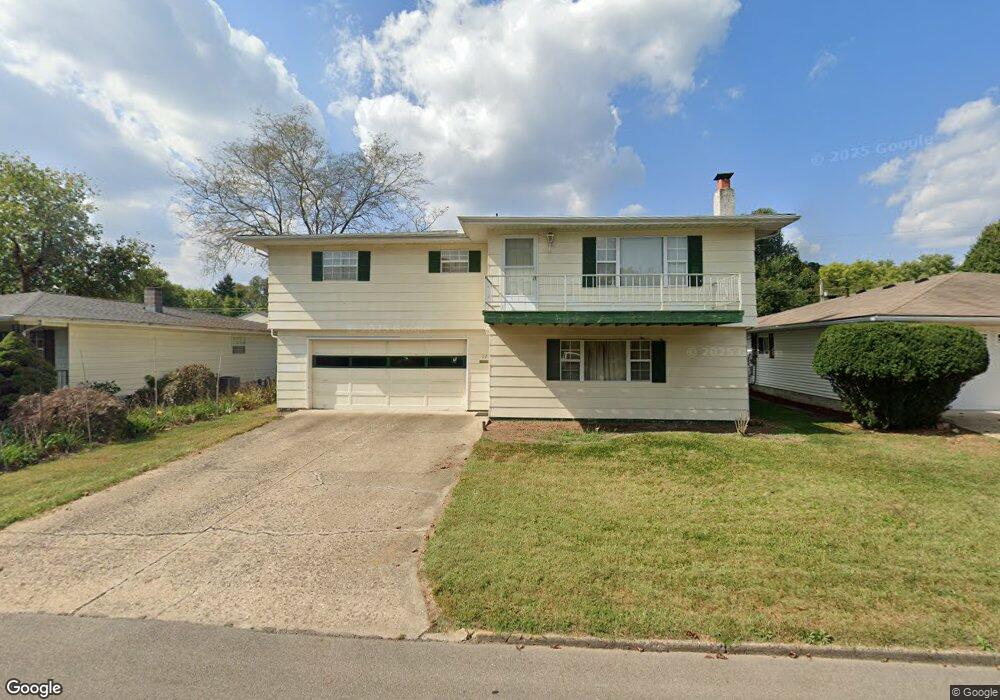
12 Charles St Athens, OH 45701
Estimated Value: $287,084 - $372,000
3
Beds
2
Baths
1,936
Sq Ft
$171/Sq Ft
Est. Value
About This Home
This home is located at 12 Charles St, Athens, OH 45701 and is currently estimated at $330,521, approximately $170 per square foot. 12 Charles St is a home located in Athens County with nearby schools including East Elementary School, Athens Middle School, and Athens High School.
Ownership History
Date
Name
Owned For
Owner Type
Purchase Details
Closed on
Aug 21, 2009
Sold by
Garcia Thomas David and Garcia Yolanda Ann
Bought by
Webb Annette N
Current Estimated Value
Home Financials for this Owner
Home Financials are based on the most recent Mortgage that was taken out on this home.
Original Mortgage
$115,000
Outstanding Balance
$74,016
Interest Rate
5.28%
Mortgage Type
New Conventional
Estimated Equity
$256,506
Purchase Details
Closed on
May 22, 2006
Sold by
Park Soon S and Lee Soo
Bought by
Garcia Thomas David and Garcia Yolanda Ann
Home Financials for this Owner
Home Financials are based on the most recent Mortgage that was taken out on this home.
Original Mortgage
$143,910
Interest Rate
6.62%
Mortgage Type
New Conventional
Purchase Details
Closed on
Jul 7, 2003
Sold by
Adams Connie Sue
Bought by
Park Soon S and Soo Lee
Purchase Details
Closed on
Nov 7, 1996
Sold by
Adams Ada Margaret
Bought by
Adams Connie Sue
Purchase Details
Closed on
Nov 6, 1996
Sold by
Adams Delbert E and Adams Ada M
Bought by
Adams Ada Margaret
Purchase Details
Closed on
Jun 1, 1988
Create a Home Valuation Report for This Property
The Home Valuation Report is an in-depth analysis detailing your home's value as well as a comparison with similar homes in the area
Home Values in the Area
Average Home Value in this Area
Purchase History
| Date | Buyer | Sale Price | Title Company |
|---|---|---|---|
| Webb Annette N | $164,800 | Attorney | |
| Garcia Thomas David | $159,900 | None Available | |
| Park Soon S | $140,000 | -- | |
| Adams Connie Sue | -- | -- | |
| Adams Ada Margaret | -- | -- | |
| -- | $72,000 | -- |
Source: Public Records
Mortgage History
| Date | Status | Borrower | Loan Amount |
|---|---|---|---|
| Open | Webb Annette N | $115,000 | |
| Previous Owner | Garcia Thomas David | $143,910 |
Source: Public Records
Tax History
| Year | Tax Paid | Tax Assessment Tax Assessment Total Assessment is a certain percentage of the fair market value that is determined by local assessors to be the total taxable value of land and additions on the property. | Land | Improvement |
|---|---|---|---|---|
| 2024 | $6,705 | $71,340 | $11,520 | $59,820 |
| 2023 | $3,530 | $71,340 | $11,520 | $59,820 |
| 2022 | $3,093 | $59,760 | $11,520 | $48,240 |
| 2021 | $3,107 | $59,760 | $11,520 | $48,240 |
| 2020 | $3,002 | $59,760 | $11,520 | $48,240 |
| 2019 | $2,901 | $56,850 | $10,060 | $46,790 |
| 2018 | $2,863 | $56,850 | $10,060 | $46,790 |
| 2017 | $2,687 | $56,850 | $10,060 | $46,790 |
| 2016 | $2,570 | $52,840 | $10,060 | $42,780 |
| 2015 | $4,826 | $52,840 | $10,060 | $42,780 |
| 2014 | $4,826 | $52,840 | $10,060 | $42,780 |
| 2013 | $4,595 | $51,710 | $10,060 | $41,650 |
Source: Public Records
Map
Nearby Homes
- 14 Euclid Dr
- 0 E State St Unit 226002681
- 37 Euclid Dr
- 44 Strathmore Blvd
- 58 Strathmore Blvd
- 12 Mc Guffey Ln
- 12 McGuffey Ln
- 305 E State St
- 104 Sunnyside Dr
- 121 Morris Ave
- 1 Northwood Dr
- 10 Joneswood Dr
- 25 Elliott St
- 0 Strouds Run Unit 2433166
- 64 Franklin Ave
- 11 Forest St
- 0 Columbus Rd
- 80 Court
- 193 N Lancaster St
- 42 Walker St
Your Personal Tour Guide
Ask me questions while you tour the home.