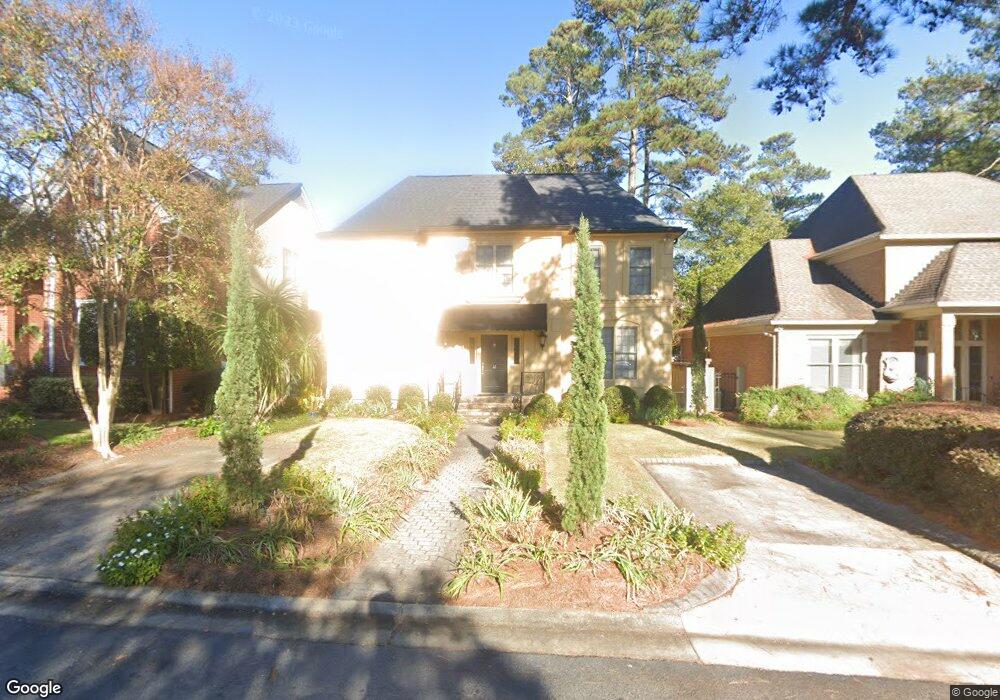
12 Conifer Square Augusta, GA 30909
West Augusta NeighborhoodEstimated Value: $379,466 - $552,000
3
Beds
3
Baths
2,425
Sq Ft
$196/Sq Ft
Est. Value
About This Home
This home is located at 12 Conifer Square, Augusta, GA 30909 and is currently estimated at $476,117, approximately $196 per square foot. 12 Conifer Square is a home located in Richmond County with nearby schools including Lake Forest Hills Elementary School, Tutt Middle School, and Johnson Magnet.
Ownership History
Date
Name
Owned For
Owner Type
Purchase Details
Closed on
Sep 15, 2006
Sold by
Norwood Lester
Bought by
Jolly Clayton L
Current Estimated Value
Home Financials for this Owner
Home Financials are based on the most recent Mortgage that was taken out on this home.
Original Mortgage
$164,900
Outstanding Balance
$97,489
Interest Rate
6.48%
Mortgage Type
Purchase Money Mortgage
Estimated Equity
$378,628
Purchase Details
Closed on
May 28, 2004
Sold by
Mosley C Glenn
Bought by
Norwood Lester
Home Financials for this Owner
Home Financials are based on the most recent Mortgage that was taken out on this home.
Original Mortgage
$184,000
Interest Rate
5.89%
Mortgage Type
Purchase Money Mortgage
Purchase Details
Closed on
Nov 4, 1993
Sold by
Welch Barbara W
Bought by
Mosley C Glenn
Purchase Details
Closed on
Jul 1, 1986
Sold by
Rick Rick and Rick Rogers Constru
Bought by
Evans Barbara W
Create a Home Valuation Report for This Property
The Home Valuation Report is an in-depth analysis detailing your home's value as well as a comparison with similar homes in the area
Home Values in the Area
Average Home Value in this Area
Purchase History
| Date | Buyer | Sale Price | Title Company |
|---|---|---|---|
| Jolly Clayton L | $289,900 | None Available | |
| Norwood Lester | $230,000 | -- | |
| Mosley C Glenn | $189,000 | -- | |
| Evans Barbara W | $160,000 | -- |
Source: Public Records
Mortgage History
| Date | Status | Borrower | Loan Amount |
|---|---|---|---|
| Open | Jolly Clayton L | $164,900 | |
| Previous Owner | Norwood Lester | $184,000 |
Source: Public Records
Tax History
| Year | Tax Paid | Tax Assessment Tax Assessment Total Assessment is a certain percentage of the fair market value that is determined by local assessors to be the total taxable value of land and additions on the property. | Land | Improvement |
|---|---|---|---|---|
| 2025 | $1,617 | $162,076 | $30,000 | $132,076 |
| 2024 | $1,617 | $162,076 | $30,000 | $132,076 |
| 2023 | $3,124 | $162,076 | $30,000 | $132,076 |
| 2022 | $3,535 | $122,893 | $30,000 | $92,893 |
| 2021 | $3,650 | $116,176 | $30,000 | $86,176 |
| 2020 | $3,126 | $100,954 | $30,000 | $70,954 |
| 2019 | $3,338 | $100,954 | $30,000 | $70,954 |
| 2018 | $3,350 | $100,552 | $30,000 | $70,552 |
| 2017 | $3,342 | $100,552 | $30,000 | $70,552 |
| 2016 | $3,413 | $100,552 | $30,000 | $70,552 |
| 2015 | $3,438 | $100,552 | $30,000 | $70,552 |
| 2014 | $3,443 | $100,552 | $30,000 | $70,552 |
Source: Public Records
Map
Nearby Homes
- 6 Conifer Square
- 36 Conifer Ln
- 71 Bristlecone Ln
- 58 Conifer Cir
- 36 Park Place Cir
- 54 Conifer Cir
- 36 Eagle Pointe Dr
- 6 Tall Pine Cir
- 3232 Skinner Mill Rd
- 14 Highgate W
- 0 Wheeler Rd
- 2921 Foxhall Cir
- 3044 Wheeler Rd
- 755 Tripps Ct
- 2944 Foxhall Cir
- 12 Summerville Ln
- 2928 Running Creek Ln
- 427 Shallowford Cir
- 429 Shallowford Cir
- 538 Regent Rd
- 14 Conifer Square
- 24 Conifer Ln
- 16 Conifer Square
- 22 Conifer Ln
- 17 Conifer Square
- 45 Conifer Place
- 8 Conifer Square
- 26 Conifer Ln
- 15 Conifer Square
- 4 Conifer Square
- 2 Conifer Square
- 11 Conifer Square
- 28 Conifer Ln
- 7 Conifer Square
- 5 Conifer Square
- 38 Conifer Ln
- 34 Conifer Ln
- 9 Conifer Square
- 40 Conifer Ln
Your Personal Tour Guide
Ask me questions while you tour the home.