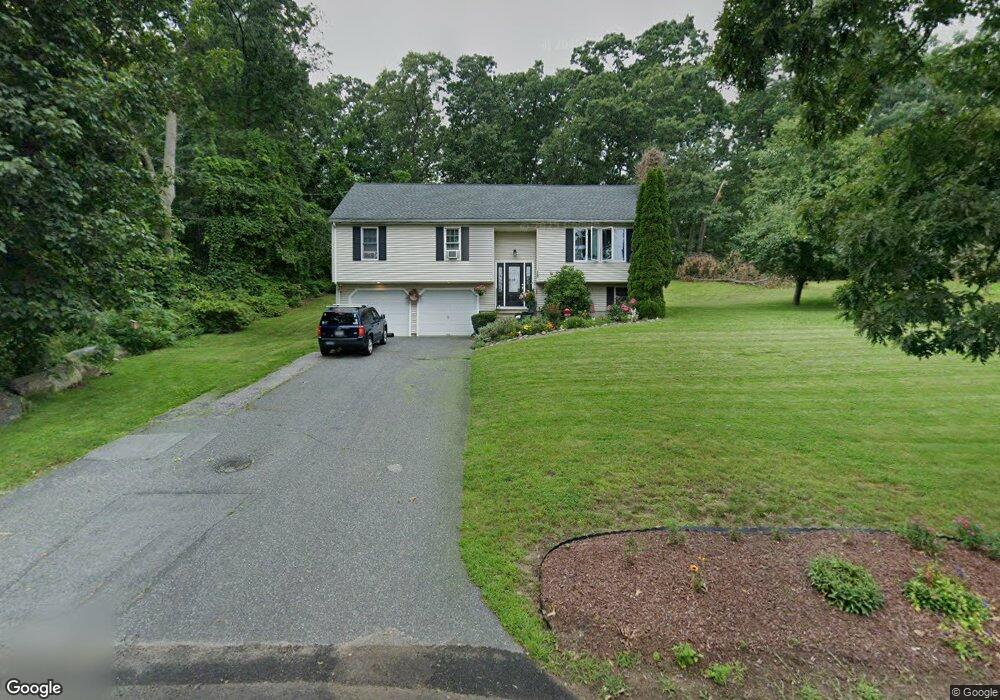
12 Crosby Rd Grafton, MA 01519
Estimated Value: $542,000 - $594,000
3
Beds
3
Baths
1,304
Sq Ft
$437/Sq Ft
Est. Value
About This Home
This home is located at 12 Crosby Rd, Grafton, MA 01519 and is currently estimated at $569,657, approximately $436 per square foot. 12 Crosby Rd is a home located in Worcester County with nearby schools including Grafton High School, Silver Spruce Montessori School, and Assumption School.
Ownership History
Date
Name
Owned For
Owner Type
Purchase Details
Closed on
Mar 20, 1997
Sold by
Mangano Albert J
Bought by
Hamilton Richard W and Hamilton Karan A
Current Estimated Value
Create a Home Valuation Report for This Property
The Home Valuation Report is an in-depth analysis detailing your home's value as well as a comparison with similar homes in the area
Home Values in the Area
Average Home Value in this Area
Purchase History
| Date | Buyer | Sale Price | Title Company |
|---|---|---|---|
| Hamilton Richard W | $159,900 | -- | |
| Hamilton Richard W | $159,900 | -- |
Source: Public Records
Mortgage History
| Date | Status | Borrower | Loan Amount |
|---|---|---|---|
| Open | Hamilton Richard W | $200,000 | |
| Closed | Hamilton Richard W | $176,600 | |
| Closed | Hamilton Richard W | $30,000 |
Source: Public Records
Tax History Compared to Growth
Tax History
| Year | Tax Paid | Tax Assessment Tax Assessment Total Assessment is a certain percentage of the fair market value that is determined by local assessors to be the total taxable value of land and additions on the property. | Land | Improvement |
|---|---|---|---|---|
| 2025 | $6,613 | $474,400 | $132,100 | $342,300 |
| 2024 | $6,557 | $458,200 | $125,900 | $332,300 |
| 2023 | $6,102 | $388,400 | $125,900 | $262,500 |
| 2022 | $5,900 | $349,500 | $108,100 | $241,400 |
| 2021 | $4,979 | $289,800 | $98,300 | $191,500 |
| 2020 | $4,739 | $287,200 | $98,300 | $188,900 |
| 2019 | $4,980 | $298,900 | $113,100 | $185,800 |
| 2018 | $5,009 | $301,900 | $111,500 | $190,400 |
| 2017 | $4,461 | $272,000 | $81,600 | $190,400 |
| 2016 | $4,668 | $278,700 | $103,500 | $175,200 |
| 2015 | $4,625 | $280,300 | $103,500 | $176,800 |
| 2014 | $3,878 | $254,100 | $103,500 | $150,600 |
Source: Public Records
Map
Nearby Homes
- 75 Potter Hill Rd
- 81 Millbury St
- 63 Providence Rd Unit 2
- 9 Logan Path
- 73 Potter Hill Rd
- 7 Pleasant St
- 19 Cortland Way
- 17 Worcester St
- 3 Millbury St
- 18 Pullard Rd
- 42 Gordon Cir Unit 42
- 11 1/2 Carroll Rd Unit B
- 30 Nottingham Rd
- 156 Brigham Hill Rd
- 29 Pullard Rd
- 4 Abby Rd
- 44 Meadow Ln
- 13 Pullard Rd Unit 38
- 43 Barbara Jean St
- 36 South St