Estimated Value: $309,000 - $339,298
2
Beds
2
Baths
1,360
Sq Ft
$243/Sq Ft
Est. Value
About This Home
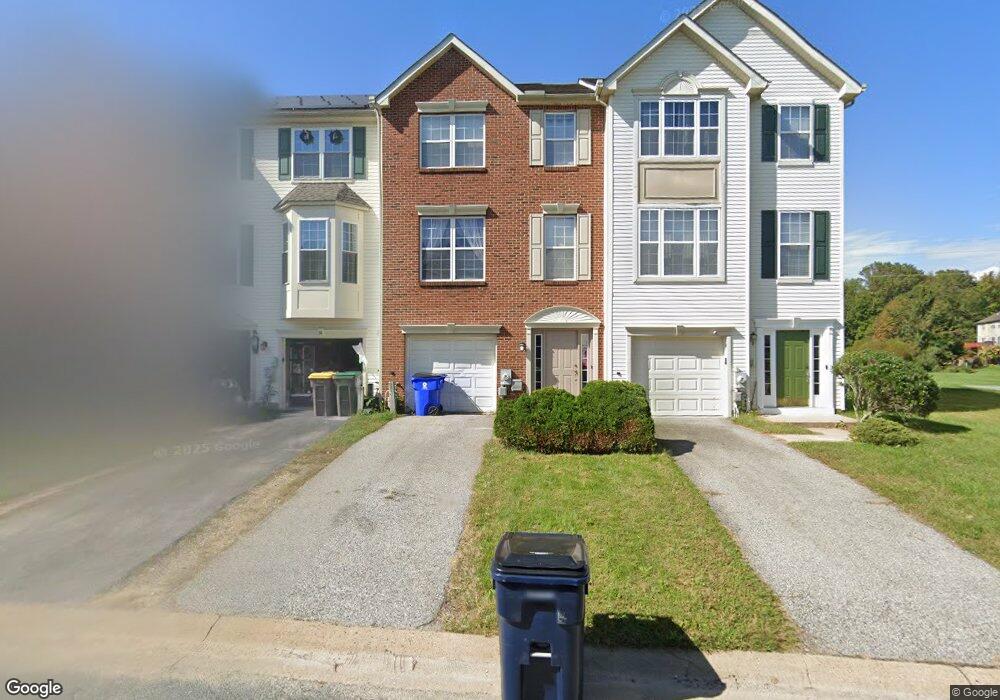
This home is located at 12 Dolmen Ln, Bear, DE 19701 and is currently estimated at $330,575, approximately $243 per square foot. 12 Dolmen Ln is a home located in New Castle County with nearby schools including Olive B. Loss Elementary School, Alfred G. Waters Middle School, and Appoquinimink High School.
Ownership History
Date
Name
Owned For
Owner Type
Purchase Details
Closed on
Oct 16, 2017
Sold by
Bell Yanique C and Bell Joseph
Bought by
Bell Yanique
Current Estimated Value
Home Financials for this Owner
Home Financials are based on the most recent Mortgage that was taken out on this home.
Original Mortgage
$170,000
Outstanding Balance
$141,094
Interest Rate
3.94%
Mortgage Type
New Conventional
Estimated Equity
$189,481
Purchase Details
Closed on
Sep 24, 2008
Sold by
Daley Yanique C and Bell Yanique C
Bought by
Bell Yanique C and Bell Joseph
Home Financials for this Owner
Home Financials are based on the most recent Mortgage that was taken out on this home.
Original Mortgage
$191,530
Interest Rate
6.54%
Mortgage Type
FHA
Purchase Details
Closed on
Sep 19, 2002
Sold by
Blenheim Homes Lp
Bought by
Daley Yanique C
Home Financials for this Owner
Home Financials are based on the most recent Mortgage that was taken out on this home.
Original Mortgage
$132,182
Interest Rate
6.36%
Create a Home Valuation Report for This Property
The Home Valuation Report is an in-depth analysis detailing your home's value as well as a comparison with similar homes in the area
Home Values in the Area
Average Home Value in this Area
Purchase History
| Date | Buyer | Sale Price | Title Company |
|---|---|---|---|
| Bell Yanique | -- | Servicelink | |
| Bell Yanique C | -- | The Security Title Guarantee | |
| Daley Yanique C | $164,455 | -- |
Source: Public Records
Mortgage History
| Date | Status | Borrower | Loan Amount |
|---|---|---|---|
| Open | Bell Yanique | $170,000 | |
| Closed | Bell Yanique C | $191,530 | |
| Closed | Daley Yanique C | $132,182 |
Source: Public Records
Tax History
| Year | Tax Paid | Tax Assessment Tax Assessment Total Assessment is a certain percentage of the fair market value that is determined by local assessors to be the total taxable value of land and additions on the property. | Land | Improvement |
|---|---|---|---|---|
| 2024 | $2,256 | $52,200 | $7,700 | $44,500 |
| 2023 | $1,928 | $52,200 | $7,700 | $44,500 |
| 2022 | $1,931 | $52,200 | $7,700 | $44,500 |
| 2021 | $1,907 | $52,200 | $7,700 | $44,500 |
| 2020 | $1,880 | $52,200 | $7,700 | $44,500 |
| 2019 | $2,067 | $52,200 | $7,700 | $44,500 |
| 2018 | $1,688 | $52,200 | $7,700 | $44,500 |
| 2017 | $1,619 | $52,200 | $7,700 | $44,500 |
| 2016 | $1,475 | $52,200 | $7,700 | $44,500 |
| 2015 | $1,437 | $52,200 | $7,700 | $44,500 |
| 2014 | $1,436 | $52,200 | $7,700 | $44,500 |
Source: Public Records
Map
Nearby Homes
- 34 Brittany Ln
- 1 Jasmine Dr
- 25 Shawn Ln
- 1 Bohemia Rd
- 103 Sarah Cir
- 4 Riva Ridge Ln
- 2 Pegasus Place
- 301 E Furrow Ln
- 7 Keeneland Ct
- 15 Eaton Place
- 61 Rose Hill Dr
- 52 Eaton Place
- 258 Dillon Cir
- 321 Jessica Dr
- 251 Dillon Cir
- 2956 Frazer Rd
- 48 Marble House Dr
- 32 Chancellorsville Cir
- 9 Hempstead Dr
- 557 Mansion House Rd
Your Personal Tour Guide
Ask me questions while you tour the home.