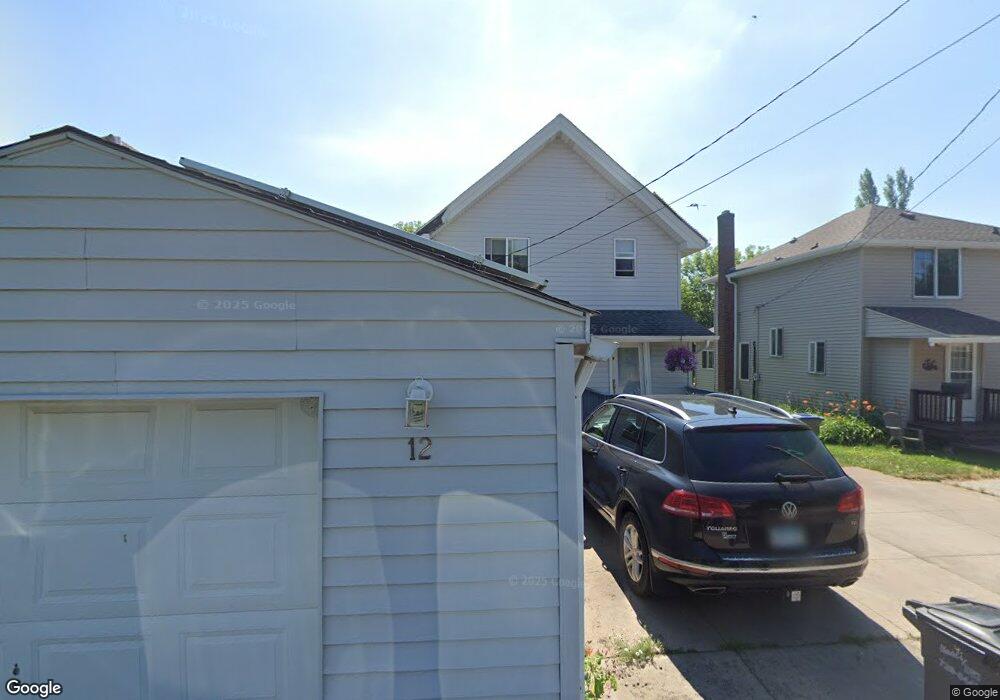
12 E Penton Blvd Duluth, MN 55808
Riverside NeighborhoodEstimated Value: $237,000 - $265,176
3
Beds
2
Baths
1,384
Sq Ft
$184/Sq Ft
Est. Value
About This Home
This home is located at 12 E Penton Blvd, Duluth, MN 55808 and is currently estimated at $254,294, approximately $183 per square foot. 12 E Penton Blvd is a home located in St. Louis County with nearby schools including Stowe Elementary School, Lincoln Park Middle School, and Denfeld High School.
Ownership History
Date
Name
Owned For
Owner Type
Purchase Details
Closed on
May 13, 2010
Sold by
Seglem Peter T and Seglem Sarah K
Bought by
Osborn Vincent O and Rigby Sharon K
Current Estimated Value
Home Financials for this Owner
Home Financials are based on the most recent Mortgage that was taken out on this home.
Original Mortgage
$142,974
Outstanding Balance
$96,630
Interest Rate
5.3%
Mortgage Type
FHA
Estimated Equity
$157,664
Purchase Details
Closed on
Jan 11, 2008
Sold by
Samuelson Investments Llc
Bought by
Seglem Peter T
Home Financials for this Owner
Home Financials are based on the most recent Mortgage that was taken out on this home.
Original Mortgage
$89,900
Interest Rate
7.5%
Mortgage Type
Seller Take Back
Purchase Details
Closed on
Jan 6, 2006
Sold by
Tesser Gary A and Skoglund Tabby B
Bought by
Samuelson Investments Llc
Create a Home Valuation Report for This Property
The Home Valuation Report is an in-depth analysis detailing your home's value as well as a comparison with similar homes in the area
Home Values in the Area
Average Home Value in this Area
Purchase History
| Date | Buyer | Sale Price | Title Company |
|---|---|---|---|
| Osborn Vincent O | $144,900 | Arrowhead | |
| Seglem Peter T | $129,900 | Arrowhead | |
| Seglem Peter T | $129,900 | None Available | |
| Samuelson Investments Llc | $32,000 | None Available |
Source: Public Records
Mortgage History
| Date | Status | Borrower | Loan Amount |
|---|---|---|---|
| Open | Osborn Vincent O | $142,974 | |
| Previous Owner | Seglem Peter T | $89,900 |
Source: Public Records
Tax History
| Year | Tax Paid | Tax Assessment Tax Assessment Total Assessment is a certain percentage of the fair market value that is determined by local assessors to be the total taxable value of land and additions on the property. | Land | Improvement |
|---|---|---|---|---|
| 2024 | $2,788 | $225,800 | $8,700 | $217,100 |
| 2023 | $2,788 | $225,800 | $8,700 | $217,100 |
| 2022 | $2,396 | $187,400 | $8,200 | $179,200 |
| 2021 | $1,986 | $164,400 | $7,200 | $157,200 |
| 2020 | $2,040 | $143,400 | $6,300 | $137,100 |
| 2019 | $1,832 | $143,300 | $6,300 | $137,000 |
| 2018 | $1,686 | $132,400 | $6,300 | $126,100 |
| 2017 | $1,688 | $131,300 | $7,700 | $123,600 |
| 2016 | $1,652 | $131,300 | $7,700 | $123,600 |
| 2015 | $1,680 | $105,900 | $6,200 | $99,700 |
| 2014 | $1,680 | $105,900 | $6,200 | $99,700 |
Source: Public Records
Map
Nearby Homes
- 125 Goldys Way
- 8408 Potters Place
- 8313 Eric Shaffer Way
- 8620 Maynard Place
- 8602 Maynard Place
- 9118 Gogebic St
- 322 N 80th Ave W
- 609 94th Ave W
- TBD Arbor St
- 9501 Seaver Ave
- 1063 86th Ave W
- 2xx S 63rd Ave W
- 3xx S 63rd Ave W
- XXX Commonwealth Ave
- 317 S 63rd Ave W
- 33 Ivy Dr
- 63 S Elder Dr
- 2 Dewberry Ln
- 121 Oak St
- 10 Glencrest Ct
- 12 E Penton Blvd
- 10 E Penton Blvd
- 14 E Penton Blvd
- 14 W Penton Blvd
- 8 E Penton Blvd
- 16 E Penton Blvd
- 15 England Ave
- 11 England Ave
- 6 E Penton Blvd
- 18 E Penton Blvd
- 17 England Ave
- 2 Union St
- 21 England Ave
- 12 England Ave
- 10 England Ave
- 8 England Ave
- 14 England Ave
- 6 England Ave
- 22 Cato Ave
- 22 Cato Ave
Your Personal Tour Guide
Ask me questions while you tour the home.