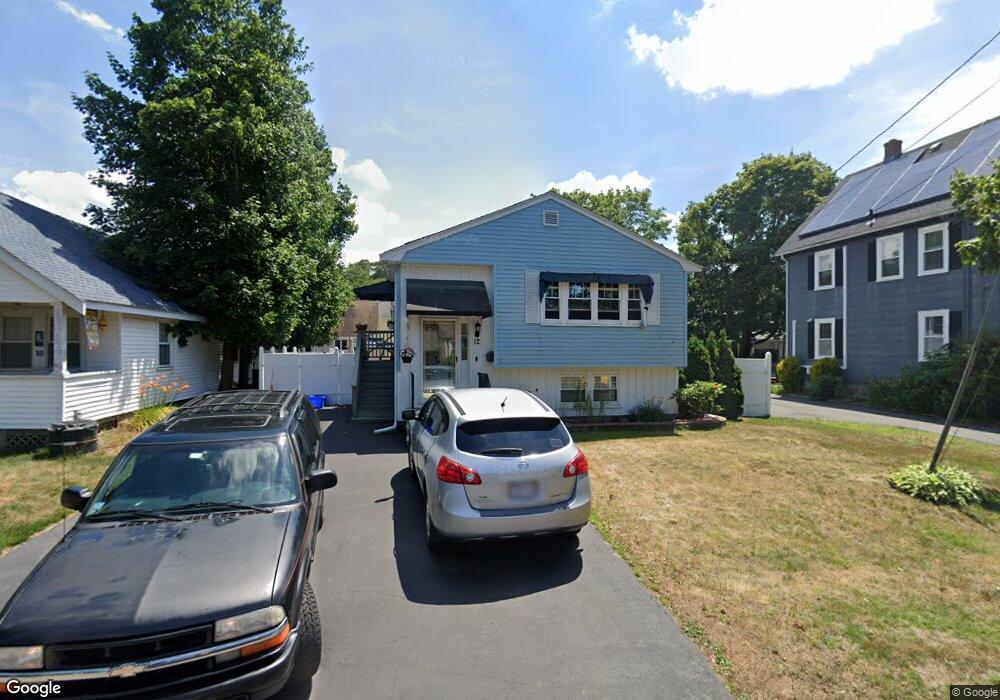
12 Felton St Saugus, MA 01906
Pleasant Hills NeighborhoodEstimated Value: $615,000 - $719,000
2
Beds
1
Bath
1,555
Sq Ft
$418/Sq Ft
Est. Value
About This Home
This home is located at 12 Felton St, Saugus, MA 01906 and is currently estimated at $650,089, approximately $418 per square foot. 12 Felton St is a home located in Essex County with nearby schools including Saugus High School, Pioneer Charter School of Science, and Pioneer Charter School Of Science II.
Ownership History
Date
Name
Owned For
Owner Type
Purchase Details
Closed on
Aug 1, 2006
Sold by
Rmas Rt and Damico Lauragale
Bought by
Dibartolomeo Nicholas J and Dibartolomeo Donna M
Current Estimated Value
Purchase Details
Closed on
Mar 30, 2006
Sold by
Van-Horn Marjorie A
Bought by
Damico Lauragale
Create a Home Valuation Report for This Property
The Home Valuation Report is an in-depth analysis detailing your home's value as well as a comparison with similar homes in the area
Home Values in the Area
Average Home Value in this Area
Purchase History
| Date | Buyer | Sale Price | Title Company |
|---|---|---|---|
| Dibartolomeo Nicholas J | $330,000 | -- | |
| Damico Lauragale | $326,000 | -- |
Source: Public Records
Mortgage History
| Date | Status | Borrower | Loan Amount |
|---|---|---|---|
| Open | Damico Lauragale | $221,000 | |
| Closed | Damico Lauragale | $230,978 | |
| Closed | Damico Lauragale | $25,000 |
Source: Public Records
Tax History Compared to Growth
Tax History
| Year | Tax Paid | Tax Assessment Tax Assessment Total Assessment is a certain percentage of the fair market value that is determined by local assessors to be the total taxable value of land and additions on the property. | Land | Improvement |
|---|---|---|---|---|
| 2025 | $5,867 | $549,300 | $315,300 | $234,000 |
| 2024 | $5,722 | $537,300 | $306,800 | $230,500 |
| 2023 | $5,516 | $489,900 | $268,400 | $221,500 |
| 2022 | $5,555 | $462,500 | $249,700 | $212,800 |
| 2021 | $5,182 | $419,900 | $207,100 | $212,800 |
| 2020 | $4,756 | $399,000 | $196,800 | $202,200 |
| 2019 | $4,613 | $378,700 | $187,500 | $191,200 |
| 2018 | $4,195 | $362,300 | $178,900 | $183,400 |
| 2017 | $4,010 | $332,800 | $170,400 | $162,400 |
| 2016 | $3,388 | $277,700 | $161,800 | $115,900 |
| 2015 | $3,179 | $264,500 | $154,100 | $110,400 |
| 2014 | $2,978 | $256,500 | $154,100 | $102,400 |
Source: Public Records
Map
Nearby Homes