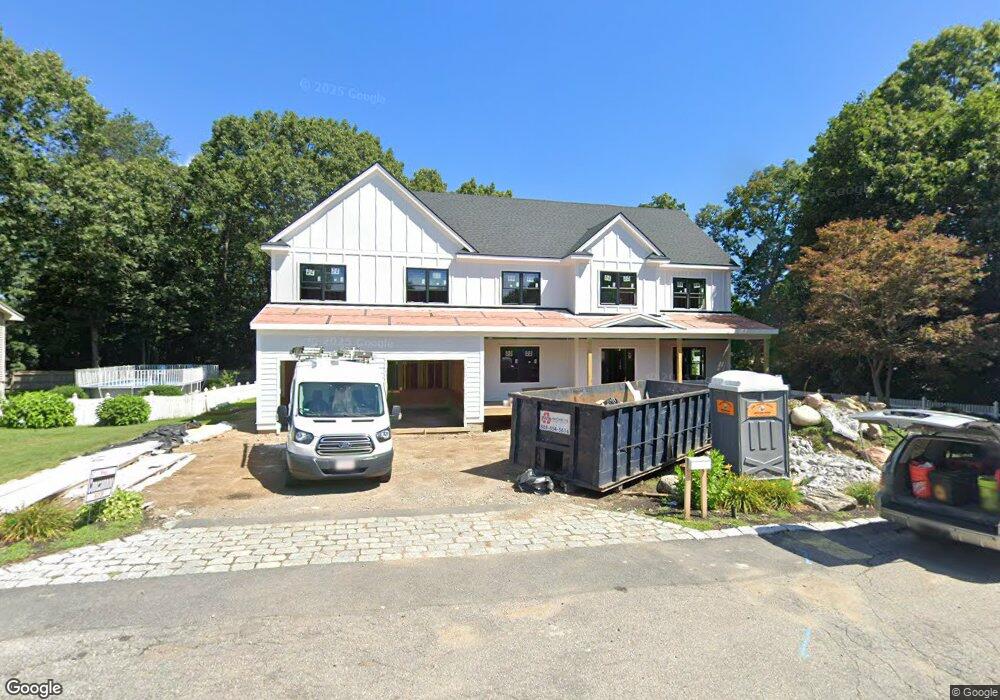
12 Frank Street Ct Woburn, MA 01801
Downtown Woburn NeighborhoodEstimated Value: $1,348,000 - $1,923,000
4
Beds
4
Baths
4,348
Sq Ft
$376/Sq Ft
Est. Value
About This Home
This home is located at 12 Frank Street Ct, Woburn, MA 01801 and is currently estimated at $1,633,340, approximately $375 per square foot. 12 Frank Street Ct is a home located in Middlesex County with nearby schools including Goodyear Elementary School, John F. Kennedy Middle School, and Woburn High School.
Ownership History
Date
Name
Owned For
Owner Type
Purchase Details
Closed on
Jul 10, 2023
Sold by
Toro Robert and Toro Amanda
Bought by
12 Frank Street Court Rt and Toro
Current Estimated Value
Purchase Details
Closed on
Feb 15, 1989
Sold by
Muse Karl J
Bought by
Griffith Scott T
Create a Home Valuation Report for This Property
The Home Valuation Report is an in-depth analysis detailing your home's value as well as a comparison with similar homes in the area
Home Values in the Area
Average Home Value in this Area
Purchase History
| Date | Buyer | Sale Price | Title Company |
|---|---|---|---|
| 12 Frank Street Court Rt | -- | None Available | |
| 12 Frank Street Court Rt | -- | None Available | |
| Griffith Scott T | $220,000 | -- |
Source: Public Records
Mortgage History
| Date | Status | Borrower | Loan Amount |
|---|---|---|---|
| Previous Owner | Griffith Scott T | $512,800 | |
| Previous Owner | Griffith Scott T | $140,000 |
Source: Public Records
Tax History Compared to Growth
Tax History
| Year | Tax Paid | Tax Assessment Tax Assessment Total Assessment is a certain percentage of the fair market value that is determined by local assessors to be the total taxable value of land and additions on the property. | Land | Improvement |
|---|---|---|---|---|
| 2025 | $12,917 | $1,512,500 | $334,900 | $1,177,600 |
| 2024 | $6,229 | $772,800 | $318,900 | $453,900 |
| 2023 | $6,075 | $698,300 | $290,000 | $408,300 |
| 2022 | $6,034 | $646,000 | $252,200 | $393,800 |
| 2021 | $7,933 | $622,800 | $240,200 | $382,600 |
| 2020 | $5,585 | $599,300 | $240,200 | $359,100 |
| 2019 | $5,425 | $571,100 | $228,800 | $342,300 |
| 2018 | $5,148 | $520,500 | $209,900 | $310,600 |
| 2017 | $17,323 | $489,200 | $200,000 | $289,200 |
| 2016 | $4,652 | $462,900 | $186,900 | $276,000 |
| 2015 | $4,494 | $441,900 | $174,700 | $267,200 |
| 2014 | $4,360 | $417,600 | $174,700 | $242,900 |
Source: Public Records
Map
Nearby Homes
- 3 Frank St
- 18 Carmen Terrace
- 18 Central St
- 3 Laurel St
- 13 Fremont St Unit 13
- 35 Grape St
- 1 Boline Place
- 18 Gardner Ave
- 6 Stratton Dr Unit 404
- 19 Mason Way Unit 75
- 2 Mason Way Unit 6524
- 6 Mason Way Unit 6324
- 10 Mason Way Unit 61
- 62 Jefferson Ave
- 69 Eastern Ave
- 14 Grant Rd
- 2 Eastern Ave
- 2 Archer Dr Unit 1
- 2 Stratton Dr Unit 1109
- 295 Salem St Unit 69
- 14 Frank Street Ct
- 11 Tremont St
- 11 Frank Street Ct
- 7 Tremont St
- 9 Tremont St
- 7 Tremont St Unit 1
- 9 Tremont St Unit 2
- 10 Frank Street Ct
- 15 Tremont St
- 2 Frank St
- 9 Frank Street Ct
- 17 Tremont St
- 3 Tremont St
- 3 Tremont St Unit 1
- 10 Tremont St
- 1 Frank St
- 12 Tremont St
- 181 Green St
- 8 Frank St
- 8 Frank St Unit B