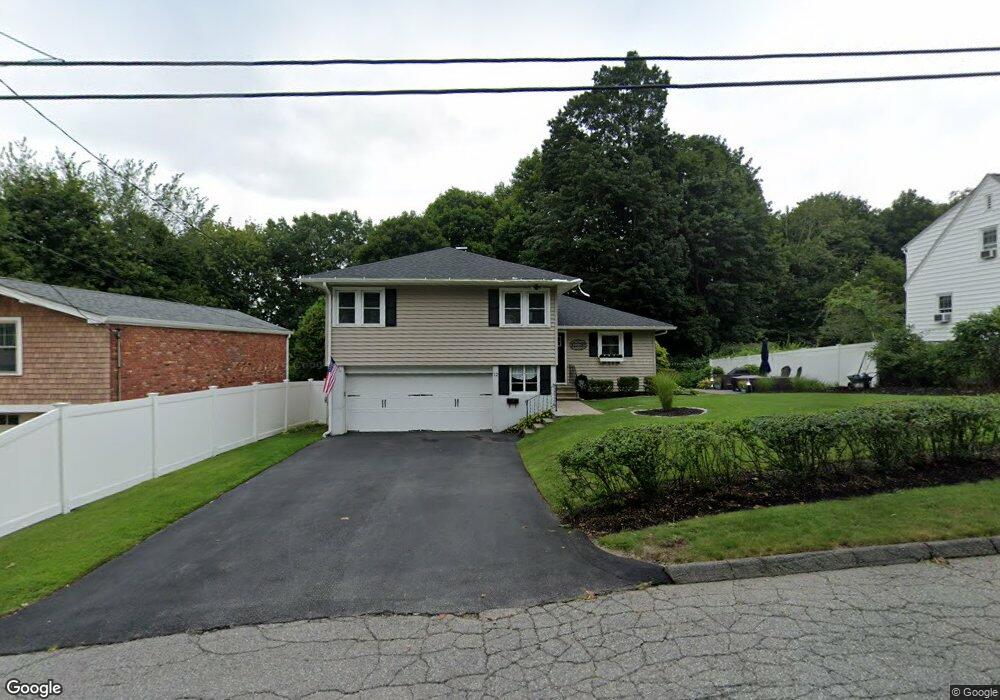
12 Hapgood Rd Worcester, MA 01605
Forest Grove NeighborhoodEstimated Value: $447,682 - $548,000
3
Beds
3
Baths
1,296
Sq Ft
$374/Sq Ft
Est. Value
About This Home
This home is located at 12 Hapgood Rd, Worcester, MA 01605 and is currently estimated at $484,671, approximately $373 per square foot. 12 Hapgood Rd is a home located in Worcester County with nearby schools including Nelson Place Elementary School, Jacob Hiatt Magnet School, and Chandler Magnet.
Ownership History
Date
Name
Owned For
Owner Type
Purchase Details
Closed on
Oct 30, 2009
Sold by
Mcnamara David B
Bought by
Crue Amy E and Crue James M
Current Estimated Value
Home Financials for this Owner
Home Financials are based on the most recent Mortgage that was taken out on this home.
Original Mortgage
$227,601
Outstanding Balance
$149,070
Interest Rate
5.06%
Mortgage Type
Purchase Money Mortgage
Estimated Equity
$335,601
Purchase Details
Closed on
Jun 22, 2007
Sold by
Holmes Nt and Holmes G Everett
Bought by
Mcnamara David B
Home Financials for this Owner
Home Financials are based on the most recent Mortgage that was taken out on this home.
Original Mortgage
$207,200
Interest Rate
6.14%
Mortgage Type
Purchase Money Mortgage
Create a Home Valuation Report for This Property
The Home Valuation Report is an in-depth analysis detailing your home's value as well as a comparison with similar homes in the area
Home Values in the Area
Average Home Value in this Area
Purchase History
| Date | Buyer | Sale Price | Title Company |
|---|---|---|---|
| Crue Amy E | $231,800 | -- | |
| Mcnamara David B | $259,000 | -- |
Source: Public Records
Mortgage History
| Date | Status | Borrower | Loan Amount |
|---|---|---|---|
| Open | Crue Amy E | $227,601 | |
| Previous Owner | Mcnamara David B | $207,200 |
Source: Public Records
Tax History
| Year | Tax Paid | Tax Assessment Tax Assessment Total Assessment is a certain percentage of the fair market value that is determined by local assessors to be the total taxable value of land and additions on the property. | Land | Improvement |
|---|---|---|---|---|
| 2025 | $4,661 | $353,400 | $123,700 | $229,700 |
| 2024 | $4,576 | $332,800 | $123,700 | $209,100 |
| 2023 | $4,540 | $316,600 | $106,500 | $210,100 |
| 2022 | $4,160 | $273,500 | $85,200 | $188,300 |
| 2021 | $4,203 | $258,200 | $68,200 | $190,000 |
| 2020 | $3,942 | $231,900 | $68,000 | $163,900 |
| 2019 | $3,922 | $217,900 | $65,600 | $152,300 |
| 2018 | $3,890 | $205,700 | $65,600 | $140,100 |
| 2017 | $3,856 | $200,600 | $65,600 | $135,000 |
| 2016 | $3,798 | $184,300 | $54,200 | $130,100 |
| 2015 | $3,699 | $184,300 | $54,200 | $130,100 |
| 2014 | $3,591 | $183,800 | $54,200 | $129,600 |
Source: Public Records
Map
Nearby Homes
Your Personal Tour Guide
Ask me questions while you tour the home.