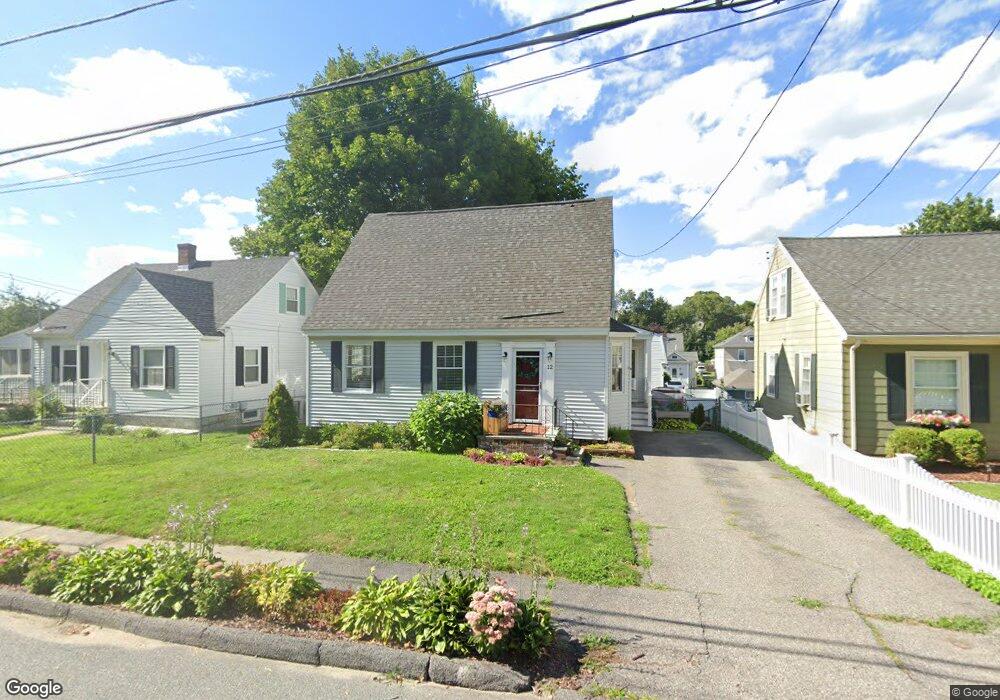
12 Hemenway St Methuen, MA 01844
Downtown Methuen NeighborhoodEstimated Value: $530,247 - $620,000
2
Beds
2
Baths
2,021
Sq Ft
$279/Sq Ft
Est. Value
About This Home
This home is located at 12 Hemenway St, Methuen, MA 01844 and is currently estimated at $564,312, approximately $279 per square foot. 12 Hemenway St is a home located in Essex County with nearby schools including Mendota Elementary School, Tenney Grammar School, and South Point Elementary School.
Ownership History
Date
Name
Owned For
Owner Type
Purchase Details
Closed on
Apr 28, 2000
Sold by
Doyle Sean M and Doyle Patricia Anne
Bought by
Edgerly Charles E and Edgerly Jennifer A
Current Estimated Value
Purchase Details
Closed on
Jul 15, 1994
Sold by
Fay John P
Bought by
Doyle Sean M
Purchase Details
Closed on
Nov 28, 1989
Sold by
Solomon Thomas
Bought by
Fay John
Create a Home Valuation Report for This Property
The Home Valuation Report is an in-depth analysis detailing your home's value as well as a comparison with similar homes in the area
Home Values in the Area
Average Home Value in this Area
Purchase History
| Date | Buyer | Sale Price | Title Company |
|---|---|---|---|
| Edgerly Charles E | $165,000 | -- | |
| Edgerly Charles E | $165,000 | -- | |
| Doyle Sean M | $108,000 | -- | |
| Doyle Sean M | $108,000 | -- | |
| Fay John | $135,000 | -- | |
| Fay John | $135,000 | -- |
Source: Public Records
Mortgage History
| Date | Status | Borrower | Loan Amount |
|---|---|---|---|
| Open | Fay John | $30,000 | |
| Open | Fay John | $150,000 |
Source: Public Records
Tax History Compared to Growth
Tax History
| Year | Tax Paid | Tax Assessment Tax Assessment Total Assessment is a certain percentage of the fair market value that is determined by local assessors to be the total taxable value of land and additions on the property. | Land | Improvement |
|---|---|---|---|---|
| 2025 | $4,714 | $445,600 | $191,900 | $253,700 |
| 2024 | $4,656 | $428,700 | $175,000 | $253,700 |
| 2023 | $4,351 | $371,900 | $155,600 | $216,300 |
| 2022 | $4,031 | $308,900 | $123,200 | $185,700 |
| 2021 | $3,828 | $290,200 | $116,700 | $173,500 |
| 2020 | $3,834 | $285,300 | $116,700 | $168,600 |
| 2019 | $3,722 | $262,300 | $110,200 | $152,100 |
| 2018 | $3,548 | $248,600 | $103,700 | $144,900 |
| 2017 | $3,428 | $234,000 | $103,700 | $130,300 |
| 2016 | $3,091 | $208,700 | $90,700 | $118,000 |
| 2015 | $2,958 | $202,600 | $90,700 | $111,900 |
Source: Public Records
Map
Nearby Homes
- 57 Strathmore Rd
- 14-16 Cypress Ave
- 749-751 Riverside Dr
- 32 Glen Ave
- 88-90 Columbus Ave
- 68 Middlebury St
- 47 Hallenan Ave
- 2 Maurice Ave
- 945 Riverside Dr Unit 2A
- 2 Glen Forest Ln
- 265 Ames St
- 134 Haverhill St
- 1008 Essex St Unit 1010
- 450 Riverside Dr Unit 1
- 439-443 Riverside Dr
- 30-32 Linden St
- 8 Francella Rd
- 18 Ames St
- 62-66 Butler St
- 44-46 Butler St