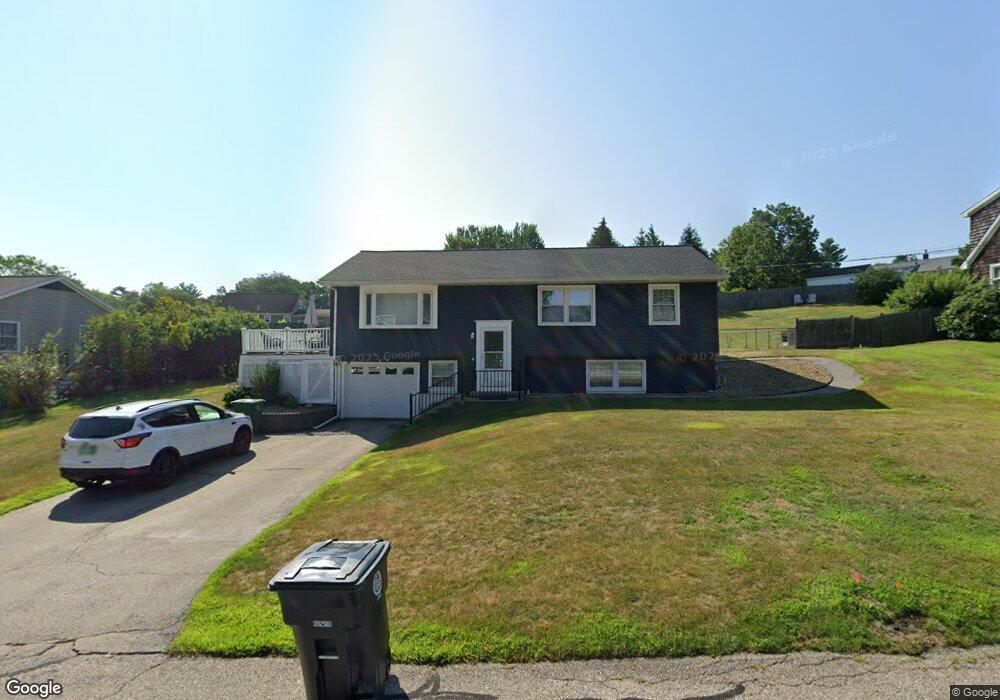
12 Iroquois Rd Nashua, NH 03063
Northwest Nashua NeighborhoodEstimated Value: $457,000 - $600,000
3
Beds
2
Baths
1,456
Sq Ft
$357/Sq Ft
Est. Value
About This Home
This home is located at 12 Iroquois Rd, Nashua, NH 03063 and is currently estimated at $519,166, approximately $356 per square foot. 12 Iroquois Rd is a home located in Hillsborough County with nearby schools including Broad Street Elementary School, Elm Street Middle School, and Nashua High School North.
Ownership History
Date
Name
Owned For
Owner Type
Purchase Details
Closed on
Nov 29, 2005
Sold by
Oliver Kristopher L and Oliver Michelle M
Bought by
Caterino Dennis
Current Estimated Value
Home Financials for this Owner
Home Financials are based on the most recent Mortgage that was taken out on this home.
Original Mortgage
$216,000
Interest Rate
6.06%
Mortgage Type
Purchase Money Mortgage
Purchase Details
Closed on
Apr 19, 2002
Sold by
Lacroix Brian J and Lacroix Marianne
Bought by
Oliver Kristopher L and Oliver Michelle M
Home Financials for this Owner
Home Financials are based on the most recent Mortgage that was taken out on this home.
Original Mortgage
$218,169
Interest Rate
6.85%
Mortgage Type
Purchase Money Mortgage
Purchase Details
Closed on
May 1, 2000
Sold by
Grabeau Glenn D and Grabeau Raeleen A
Bought by
Lacroix Brian J and Lacroix Marianne
Create a Home Valuation Report for This Property
The Home Valuation Report is an in-depth analysis detailing your home's value as well as a comparison with similar homes in the area
Home Values in the Area
Average Home Value in this Area
Purchase History
| Date | Buyer | Sale Price | Title Company |
|---|---|---|---|
| Caterino Dennis | $270,000 | -- | |
| Oliver Kristopher L | $219,900 | -- | |
| Lacroix Brian J | $145,900 | -- |
Source: Public Records
Mortgage History
| Date | Status | Borrower | Loan Amount |
|---|---|---|---|
| Open | Lacroix Brian J | $228,000 | |
| Closed | Lacroix Brian J | $57,000 | |
| Closed | Lacroix Brian J | $216,000 | |
| Previous Owner | Lacroix Brian J | $218,169 |
Source: Public Records
Tax History Compared to Growth
Tax History
| Year | Tax Paid | Tax Assessment Tax Assessment Total Assessment is a certain percentage of the fair market value that is determined by local assessors to be the total taxable value of land and additions on the property. | Land | Improvement |
|---|---|---|---|---|
| 2024 | $7,036 | $442,500 | $168,800 | $273,700 |
| 2023 | $6,353 | $348,500 | $135,000 | $213,500 |
| 2022 | $6,297 | $348,500 | $135,000 | $213,500 |
| 2021 | $5,631 | $242,500 | $90,000 | $152,500 |
| 2020 | $5,558 | $245,800 | $90,000 | $155,800 |
| 2019 | $5,349 | $245,800 | $90,000 | $155,800 |
| 2018 | $5,213 | $245,800 | $90,000 | $155,800 |
| 2017 | $5,197 | $201,500 | $73,200 | $128,300 |
| 2016 | $5,052 | $201,500 | $73,200 | $128,300 |
| 2015 | $4,943 | $201,500 | $73,200 | $128,300 |
| 2014 | $4,846 | $201,500 | $73,200 | $128,300 |
Source: Public Records
Map
Nearby Homes
- 424 Broad St
- 5 Meghan Dr Unit U23
- 239 Broad St
- 14 Parrish Hill Dr
- 6 Cornwall Ln Unit 7
- 4 Nelson St
- 27 Country Hill Rd Unit U90
- 3 Richmond St
- 599 W Hollis St
- 8 Althea Ln Unit U26
- 247 Main Dunstable Rd
- 36 Hampton Dr
- 41 New Dunstable Rd Unit 371
- 22 New Dunstable Rd Unit 132133
- 46 Scenic Dr
- 47 Dogwood Dr Unit U202
- 19 Dunloggin Rd
- 4 Jared Cir Unit U21
- 5 Chatfield Dr Unit U18
- 40 Spring Cove Rd Unit U117