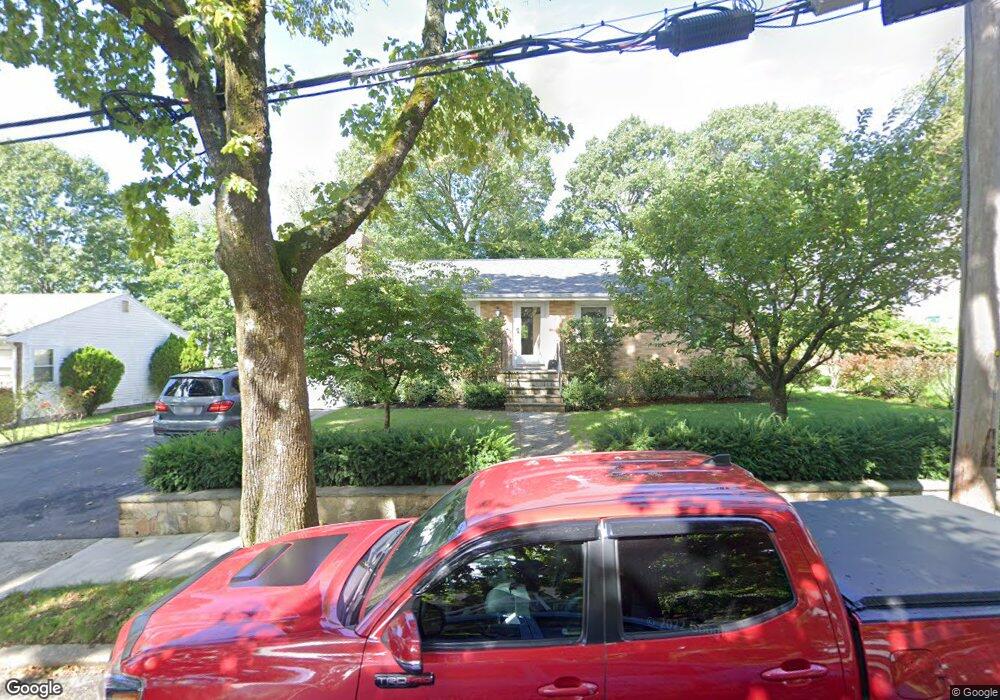
12 James St West Newton, MA 02465
West Newton NeighborhoodEstimated Value: $1,067,000 - $1,397,962
6
Beds
2
Baths
1,134
Sq Ft
$1,039/Sq Ft
Est. Value
About This Home
This home is located at 12 James St, West Newton, MA 02465 and is currently estimated at $1,177,991, approximately $1,038 per square foot. 12 James St is a home located in Middlesex County with nearby schools including C.C. Burr, Franklin Elementary School, and F.A. Day Middle School.
Ownership History
Date
Name
Owned For
Owner Type
Purchase Details
Closed on
Apr 17, 2012
Sold by
Bianchi Michael P and Roche Jessica B
Bought by
Bianchi Michael P and Roche Jessica B
Current Estimated Value
Purchase Details
Closed on
Oct 28, 1991
Sold by
Caruso Vincenzo and Caruso Rosario
Bought by
Caruso Jessie
Home Financials for this Owner
Home Financials are based on the most recent Mortgage that was taken out on this home.
Original Mortgage
$90,000
Interest Rate
8.98%
Mortgage Type
Purchase Money Mortgage
Create a Home Valuation Report for This Property
The Home Valuation Report is an in-depth analysis detailing your home's value as well as a comparison with similar homes in the area
Home Values in the Area
Average Home Value in this Area
Purchase History
| Date | Buyer | Sale Price | Title Company |
|---|---|---|---|
| Bianchi Michael P | -- | -- | |
| Caruso Jessie | $135,399 | -- |
Source: Public Records
Mortgage History
| Date | Status | Borrower | Loan Amount |
|---|---|---|---|
| Previous Owner | Caruso Jessie | $100,000 | |
| Previous Owner | Caruso Jessie | $90,000 |
Source: Public Records
Tax History Compared to Growth
Tax History
| Year | Tax Paid | Tax Assessment Tax Assessment Total Assessment is a certain percentage of the fair market value that is determined by local assessors to be the total taxable value of land and additions on the property. | Land | Improvement |
|---|---|---|---|---|
| 2025 | $8,167 | $833,400 | $754,700 | $78,700 |
| 2024 | $7,897 | $809,100 | $732,700 | $76,400 |
| 2023 | $7,431 | $730,000 | $593,600 | $136,400 |
| 2022 | $7,110 | $675,900 | $549,600 | $126,300 |
| 2021 | $6,672 | $620,100 | $504,200 | $115,900 |
| 2020 | $6,474 | $620,100 | $504,200 | $115,900 |
| 2019 | $6,056 | $579,500 | $471,200 | $108,300 |
| 2018 | $6,015 | $555,900 | $446,200 | $109,700 |
| 2017 | $5,671 | $510,000 | $409,400 | $100,600 |
| 2016 | $5,325 | $467,900 | $375,600 | $92,300 |
| 2015 | $5,077 | $437,300 | $351,000 | $86,300 |
Source: Public Records
Map
Nearby Homes
- 334 River St
- 265-267 River St Unit 267
- 265-267 River St Unit 265
- 101-103 Lexington St
- 33 Lill Ave
- 31-37 Washington Ave
- 56 Dearborn St
- 5-7 Chester Ave
- 24 Tolman St Unit A
- 73 Orange St Unit 2
- 25 Tolman St Unit 2
- 44 Westland Ave
- 90 Auburndale Ave
- 659 Moody St Unit 2
- 160 Pine St Unit 12
- 14 Cottage Place Unit 14
- 287 Cherry St Unit 2
- 49 Staniford St
- 106 River St Unit 18
- 106 River St Unit 2