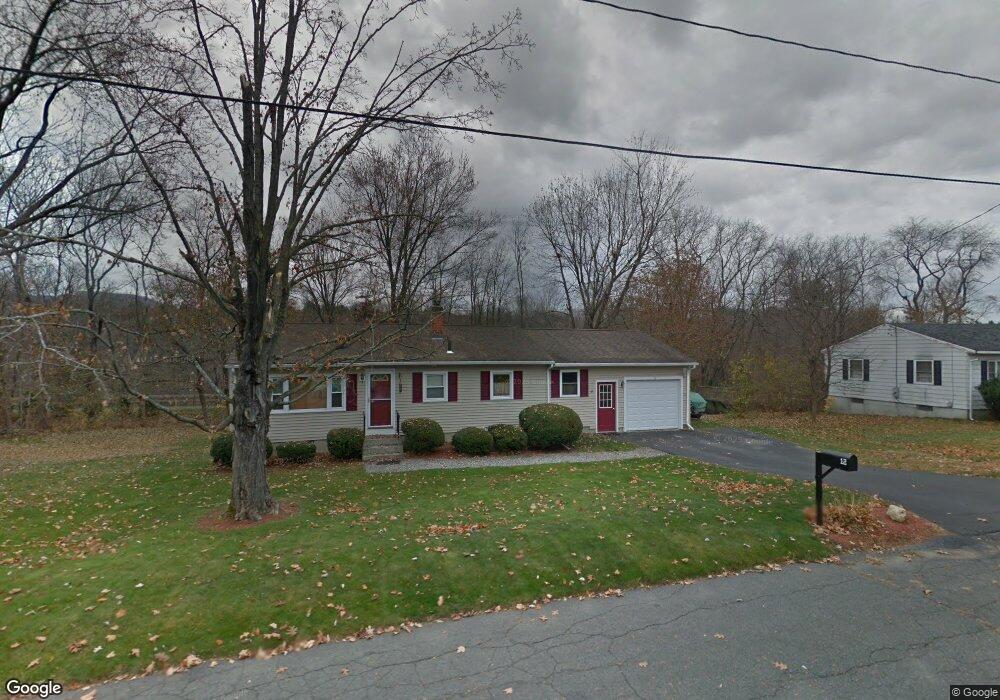
12 John St Easthampton, MA 01027
Estimated Value: $369,000 - $415,000
3
Beds
1
Bath
1,249
Sq Ft
$316/Sq Ft
Est. Value
About This Home
This home is located at 12 John St, Easthampton, MA 01027 and is currently estimated at $394,225, approximately $315 per square foot. 12 John St is a home located in Hampshire County with nearby schools including Easthampton High School, Hilltown Cooperative Charter Public School, and Calvary Baptist Christian School.
Ownership History
Date
Name
Owned For
Owner Type
Purchase Details
Closed on
Dec 8, 2009
Sold by
Scott Patricia
Bought by
Sergel Eric M
Current Estimated Value
Home Financials for this Owner
Home Financials are based on the most recent Mortgage that was taken out on this home.
Original Mortgage
$160,000
Outstanding Balance
$104,949
Interest Rate
5.01%
Mortgage Type
Purchase Money Mortgage
Estimated Equity
$289,276
Purchase Details
Closed on
Jul 31, 2007
Sold by
Lustenberger Peter E
Bought by
Sergel Eric M and Scott Patricia
Home Financials for this Owner
Home Financials are based on the most recent Mortgage that was taken out on this home.
Original Mortgage
$167,500
Interest Rate
6.78%
Mortgage Type
Purchase Money Mortgage
Purchase Details
Closed on
Jun 9, 2000
Sold by
Dearstyne Linda
Bought by
Lustenberger Peter E
Create a Home Valuation Report for This Property
The Home Valuation Report is an in-depth analysis detailing your home's value as well as a comparison with similar homes in the area
Home Values in the Area
Average Home Value in this Area
Purchase History
| Date | Buyer | Sale Price | Title Company |
|---|---|---|---|
| Sergel Eric M | -- | -- | |
| Sergel Eric M | $238,000 | -- | |
| Lustenberger Peter E | $105,900 | -- |
Source: Public Records
Mortgage History
| Date | Status | Borrower | Loan Amount |
|---|---|---|---|
| Open | Sergel Eric M | $160,000 | |
| Previous Owner | Lustenberger Peter E | $170,000 | |
| Previous Owner | Sergel Eric M | $167,500 | |
| Previous Owner | Lustenberger Peter E | $25,000 | |
| Previous Owner | Lustenberger Peter E | $18,000 |
Source: Public Records
Tax History
| Year | Tax Paid | Tax Assessment Tax Assessment Total Assessment is a certain percentage of the fair market value that is determined by local assessors to be the total taxable value of land and additions on the property. | Land | Improvement |
|---|---|---|---|---|
| 2025 | $4,934 | $360,900 | $107,600 | $253,300 |
| 2024 | $4,762 | $351,200 | $104,500 | $246,700 |
| 2023 | $3,613 | $246,600 | $82,300 | $164,300 |
| 2022 | $4,076 | $246,600 | $82,300 | $164,300 |
| 2021 | $4,587 | $261,500 | $82,300 | $179,200 |
| 2020 | $4,380 | $246,600 | $82,300 | $164,300 |
| 2019 | $3,658 | $236,600 | $82,300 | $154,300 |
| 2018 | $3,496 | $218,500 | $77,700 | $140,800 |
| 2017 | $3,412 | $210,500 | $74,700 | $135,800 |
| 2016 | $3,282 | $210,500 | $74,700 | $135,800 |
| 2015 | $3,189 | $210,500 | $74,700 | $135,800 |
Source: Public Records
Map
Nearby Homes
- 336 Main St
- 6 Wilton Rd
- 6 S St & Abutting Lots
- 385 Main St
- 2 W Park Dr
- M143 &152 Glendale St
- 26 Winter St
- 36 & 36R Holly Cir
- 131 West St Unit 131
- 19 Nicols Way Unit 19
- 38 College Hwy
- 7 Union Ct
- 4 Laurel Dr
- 4 Gaugh St
- 1 Plain St
- 11 Dragon Cir
- 40 Clark St
- Lot 3R Pomeroy Meadow Rd
- 33 Knipfer Ave
- 48 Gunn Rd
Your Personal Tour Guide
Ask me questions while you tour the home.