Estimated Value: $1,574,795 - $1,698,000
3
Beds
6
Baths
3,360
Sq Ft
$490/Sq Ft
Est. Value
About This Home
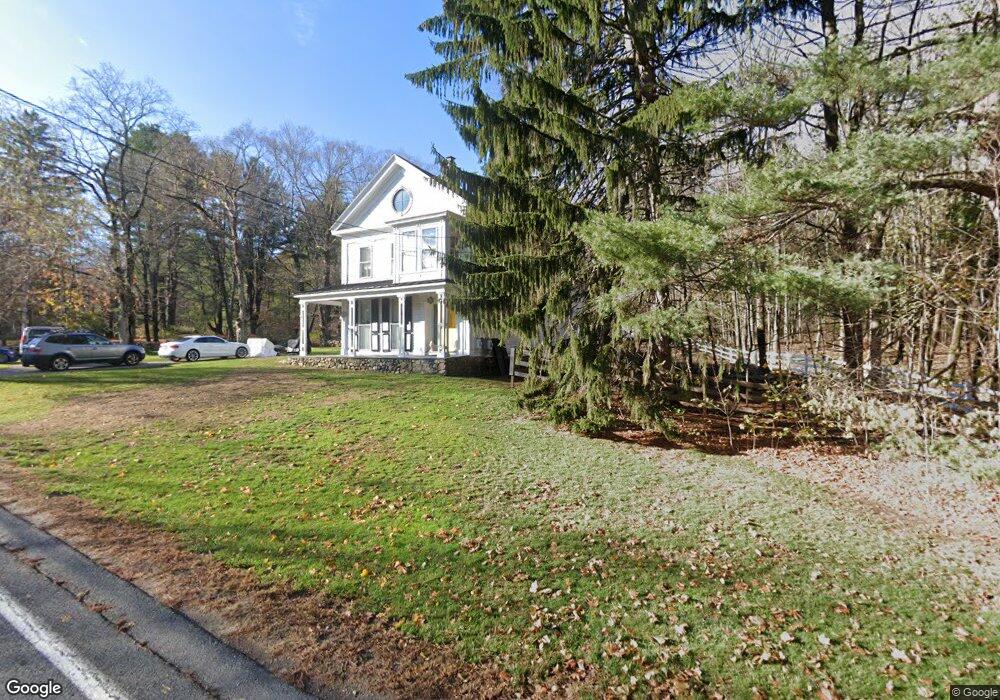
This home is located at 12 Main St, Dover, MA 02030 and is currently estimated at $1,645,699, approximately $489 per square foot. 12 Main St is a home located in Norfolk County with nearby schools including Chickering Elementary School, Dover-Sherborn Regional Middle School, and Dover-Sherborn Regional High School.
Ownership History
Date
Name
Owned For
Owner Type
Purchase Details
Closed on
Oct 19, 1993
Sold by
Gormley Christopher D
Bought by
Spitz Rachel
Current Estimated Value
Home Financials for this Owner
Home Financials are based on the most recent Mortgage that was taken out on this home.
Original Mortgage
$234,400
Interest Rate
6.87%
Mortgage Type
Purchase Money Mortgage
Create a Home Valuation Report for This Property
The Home Valuation Report is an in-depth analysis detailing your home's value as well as a comparison with similar homes in the area
Home Values in the Area
Average Home Value in this Area
Purchase History
| Date | Buyer | Sale Price | Title Company |
|---|---|---|---|
| Spitz Rachel | $293,000 | -- |
Source: Public Records
Mortgage History
| Date | Status | Borrower | Loan Amount |
|---|---|---|---|
| Open | Spitz Rachel | $443,750 | |
| Closed | Spitz Rachel | $50,000 | |
| Closed | Spitz Rachel | $234,400 |
Source: Public Records
Tax History Compared to Growth
Tax History
| Year | Tax Paid | Tax Assessment Tax Assessment Total Assessment is a certain percentage of the fair market value that is determined by local assessors to be the total taxable value of land and additions on the property. | Land | Improvement |
|---|---|---|---|---|
| 2025 | $15,983 | $1,418,200 | $664,400 | $753,800 |
| 2024 | $15,543 | $1,418,200 | $664,400 | $753,800 |
| 2023 | $13,341 | $1,094,400 | $522,800 | $571,600 |
| 2022 | $13,461 | $1,083,800 | $522,800 | $561,000 |
| 2021 | $14,038 | $1,089,100 | $522,800 | $566,300 |
| 2020 | $13,712 | $1,067,900 | $522,800 | $545,100 |
| 2019 | $13,808 | $1,067,900 | $522,800 | $545,100 |
| 2018 | $11,745 | $914,700 | $427,000 | $487,700 |
| 2017 | $12,096 | $926,900 | $413,900 | $513,000 |
| 2016 | $12,589 | $977,400 | $413,900 | $563,500 |
| 2015 | $11,643 | $916,800 | $413,900 | $502,900 |
Source: Public Records
Map
Nearby Homes
- 12 Cranberry Ln
- 12 Haven St
- 104 Glen St
- 67 Farm St
- 91 Glen St
- 18 Phillips Pond Rd
- 8 Greystone Rd
- 8 Warren Rd
- 8 Normandie Rd
- 25 Bretton Rd
- 60 Locust Ln
- 29 Water St
- 182 Winding River Rd
- 52 Willow St
- 365 Charles River St
- 78 Pheasant Landing Rd
- 1780 Central Ave
- 21 Eliot St
- 55 Ridge Hill Farm Rd
- 114 Farm St