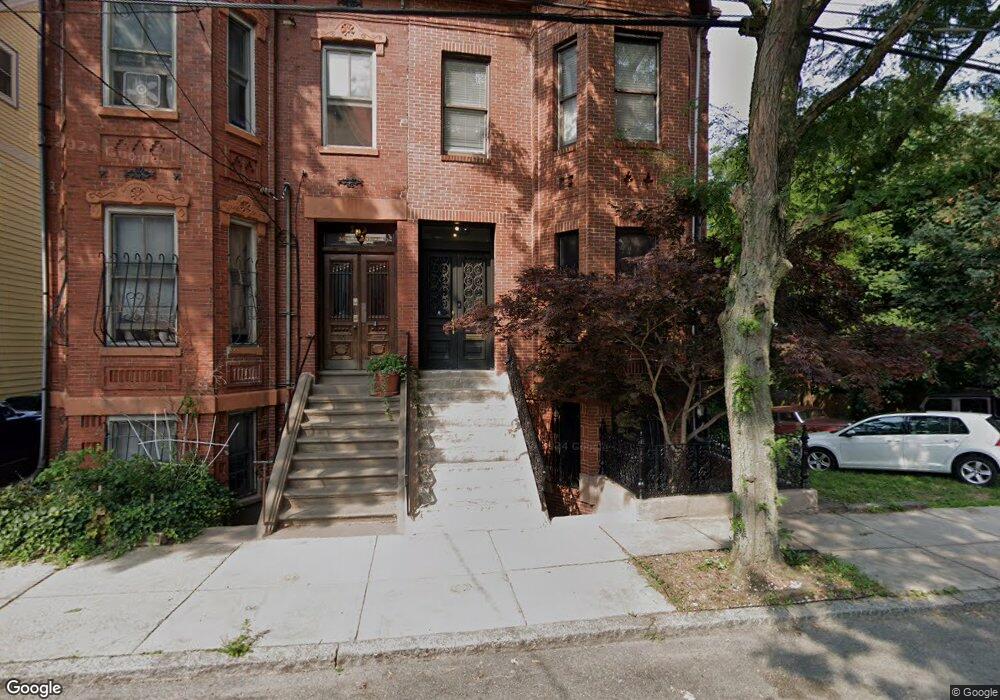
12 Millmont St Unit 2 Roxbury, MA 02119
Fort Hill NeighborhoodEstimated Value: $356,075 - $458,000
1
Bed
1
Bath
645
Sq Ft
$616/Sq Ft
Est. Value
About This Home
This home is located at 12 Millmont St Unit 2, Roxbury, MA 02119 and is currently estimated at $397,269, approximately $615 per square foot. 12 Millmont St Unit 2 is a home located in Suffolk County with nearby schools including City on a Hill Charter Public School and Paige Academy.
Ownership History
Date
Name
Owned For
Owner Type
Purchase Details
Closed on
Sep 30, 2021
Sold by
Millmont Hldg Co Llc
Bought by
Tracy Gregory
Current Estimated Value
Home Financials for this Owner
Home Financials are based on the most recent Mortgage that was taken out on this home.
Original Mortgage
$355,300
Outstanding Balance
$322,591
Interest Rate
2.8%
Mortgage Type
Purchase Money Mortgage
Estimated Equity
$74,678
Purchase Details
Closed on
Sep 26, 2019
Sold by
Hendricks Lisa
Bought by
Millmont Hldg Co Llc
Home Financials for this Owner
Home Financials are based on the most recent Mortgage that was taken out on this home.
Original Mortgage
$1,015,000
Interest Rate
3.5%
Mortgage Type
New Conventional
Purchase Details
Closed on
Jun 2, 2017
Sold by
Millmont Street Unit 1
Bought by
Hendricks Lisa
Purchase Details
Closed on
Nov 7, 2016
Sold by
12 Millmont St Unit 2
Bought by
Hendricks Lisa
Purchase Details
Closed on
Oct 12, 2016
Sold by
12 Millmont Street 2 L
Bought by
Hendricks Lisa
Purchase Details
Closed on
Mar 7, 2006
Sold by
Millmont Street Condo and Weston
Bought by
Millmont St Unit 2 Llc
Create a Home Valuation Report for This Property
The Home Valuation Report is an in-depth analysis detailing your home's value as well as a comparison with similar homes in the area
Home Values in the Area
Average Home Value in this Area
Purchase History
| Date | Buyer | Sale Price | Title Company |
|---|---|---|---|
| Tracy Gregory | $374,000 | None Available | |
| Millmont Hldg Co Llc | -- | -- | |
| Hendricks Lisa | -- | -- | |
| Hendricks Lisa | -- | -- | |
| Hendricks Lisa | -- | -- | |
| Millmont St Unit 2 Llc | -- | -- | |
| Millmont St Unit 2 Llc | -- | -- |
Source: Public Records
Mortgage History
| Date | Status | Borrower | Loan Amount |
|---|---|---|---|
| Open | Tracy Gregory | $355,300 | |
| Previous Owner | Millmont Hldg Co Llc | $1,015,000 |
Source: Public Records
Tax History Compared to Growth
Tax History
| Year | Tax Paid | Tax Assessment Tax Assessment Total Assessment is a certain percentage of the fair market value that is determined by local assessors to be the total taxable value of land and additions on the property. | Land | Improvement |
|---|---|---|---|---|
| 2025 | $3,433 | $296,500 | $0 | $296,500 |
| 2024 | $3,762 | $345,100 | $0 | $345,100 |
| 2023 | $3,564 | $331,800 | $0 | $331,800 |
| 2022 | $3,438 | $316,000 | $0 | $316,000 |
| 2021 | $3,306 | $309,800 | $0 | $309,800 |
| 2020 | $2,486 | $235,400 | $0 | $235,400 |
| 2019 | $2,256 | $214,000 | $0 | $214,000 |
| 2018 | $2,038 | $194,500 | $0 | $194,500 |
| 2017 | $1,924 | $181,700 | $0 | $181,700 |
| 2016 | $1,868 | $169,800 | $0 | $169,800 |
| 2015 | $1,710 | $141,200 | $0 | $141,200 |
| 2014 | $1,676 | $133,200 | $0 | $133,200 |
Source: Public Records
Map
Nearby Homes
- 10 Linwood St
- 49 Norfolk St
- 31 Dorr St
- 249 Roxbury St Unit 1
- 27 Dudley St
- 59 Fort Ave
- 38 Juniper St
- 4 Fort Ave Unit 2
- 9 W Cedar St Unit 1
- 51 Beech Glen St Unit 3
- 63 Beech Glen St
- 51 Saint James St
- 743 Parker St Unit 3
- 6 Fisher Ave
- 37 Regent St Unit 2
- 9-45 Vale St
- 22 Fisher Ave
- 10 Taber St Unit 501
- 2856 Washington St
- 8 Brinton St Unit 2
- 12 Millmont St Unit 3
- 12 Millmont St Unit 1
- 12 Millmont St Unit PH
- 12 Millmont St Unit C
- 12 Millmont St Unit B
- 12 Millmont St Unit A
- 10 Millmont St Unit 4
- 10 Millmont St Unit 3
- 10 Millmont St Unit 2
- 10 Millmont St Unit 1
- 10 Millmont St
- 13 Lambert St Unit 15
- 13 Lambert St Unit 1
- 13 Lambert St Unit 2
- 17 Lambert St
- 26 Millmont St Unit D
- 26 Millmont St Unit C
- 26 Millmont St Unit B
- 26 Millmont St Unit A
- 24 Millmont St Unit D