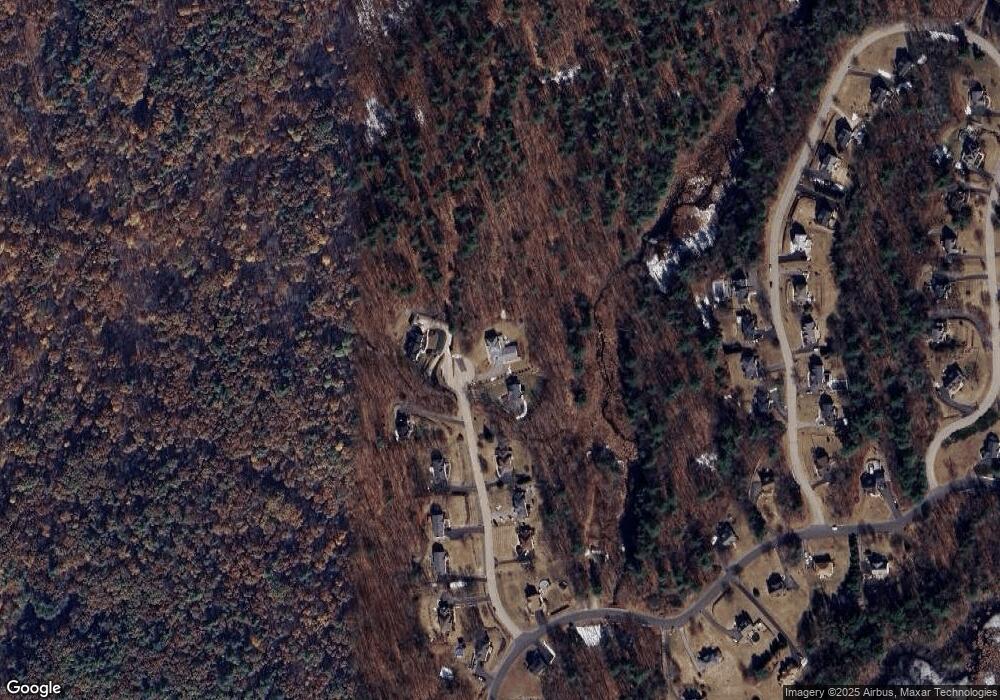
12 Partridge Cir Salem, NH 03079
North Salem NeighborhoodEstimated Value: $915,000 - $1,132,000
3
Beds
3
Baths
4,312
Sq Ft
$232/Sq Ft
Est. Value
About This Home
This home is located at 12 Partridge Cir, Salem, NH 03079 and is currently estimated at $1,001,128, approximately $232 per square foot. 12 Partridge Cir is a home located in Rockingham County with nearby schools including North Salem Elementary School, Woodbury School, and Salem High School.
Ownership History
Date
Name
Owned For
Owner Type
Purchase Details
Closed on
Mar 27, 2024
Sold by
Wolnicki Peter
Bought by
Wolnicki Ft and Wolnicki
Current Estimated Value
Purchase Details
Closed on
Jul 21, 2006
Sold by
Keo Kosal and Vazquez-Keo Dagmar E
Bought by
Wolnicki Peter
Purchase Details
Closed on
Jul 16, 2004
Sold by
Macinnis Bernard W and Macinnis Mary F
Bought by
Keo Kosal
Purchase Details
Closed on
Jun 30, 2000
Sold by
Autumn Woods Dev Llc
Bought by
Macinnis Bernard W and Macinnis Mary F
Create a Home Valuation Report for This Property
The Home Valuation Report is an in-depth analysis detailing your home's value as well as a comparison with similar homes in the area
Home Values in the Area
Average Home Value in this Area
Purchase History
| Date | Buyer | Sale Price | Title Company |
|---|---|---|---|
| Wolnicki Ft | -- | None Available | |
| Wolnicki Peter | $545,000 | -- | |
| Wolnicki Peter | $545,000 | -- | |
| Keo Kosal | $530,000 | -- | |
| Keo Kosal | $530,000 | -- | |
| Macinnis Bernard W | $320,000 | -- | |
| Macinnis Bernard W | $320,000 | -- |
Source: Public Records
Mortgage History
| Date | Status | Borrower | Loan Amount |
|---|---|---|---|
| Previous Owner | Macinnis Bernard W | $27,700 | |
| Previous Owner | Macinnis Bernard W | $314,000 |
Source: Public Records
Tax History Compared to Growth
Tax History
| Year | Tax Paid | Tax Assessment Tax Assessment Total Assessment is a certain percentage of the fair market value that is determined by local assessors to be the total taxable value of land and additions on the property. | Land | Improvement |
|---|---|---|---|---|
| 2024 | $13,276 | $754,300 | $192,900 | $561,400 |
| 2023 | $12,645 | $745,600 | $192,900 | $552,700 |
| 2022 | $11,967 | $745,600 | $192,900 | $552,700 |
| 2021 | $11,915 | $745,600 | $192,900 | $552,700 |
| 2020 | $12,038 | $546,700 | $137,700 | $409,000 |
| 2019 | $12,016 | $546,700 | $137,700 | $409,000 |
| 2018 | $9,621 | $445,200 | $137,700 | $307,500 |
| 2017 | $9,278 | $445,200 | $137,700 | $307,500 |
| 2016 | $9,095 | $445,200 | $137,700 | $307,500 |
| 2015 | $8,423 | $393,800 | $136,600 | $257,200 |
| 2014 | $8,187 | $393,800 | $136,600 | $257,200 |
| 2013 | $8,057 | $393,800 | $136,600 | $257,200 |
Source: Public Records
Map
Nearby Homes