12 Pond Path North Hampton, NH 03862
Estimated Value: $1,500,000 - $1,873,000
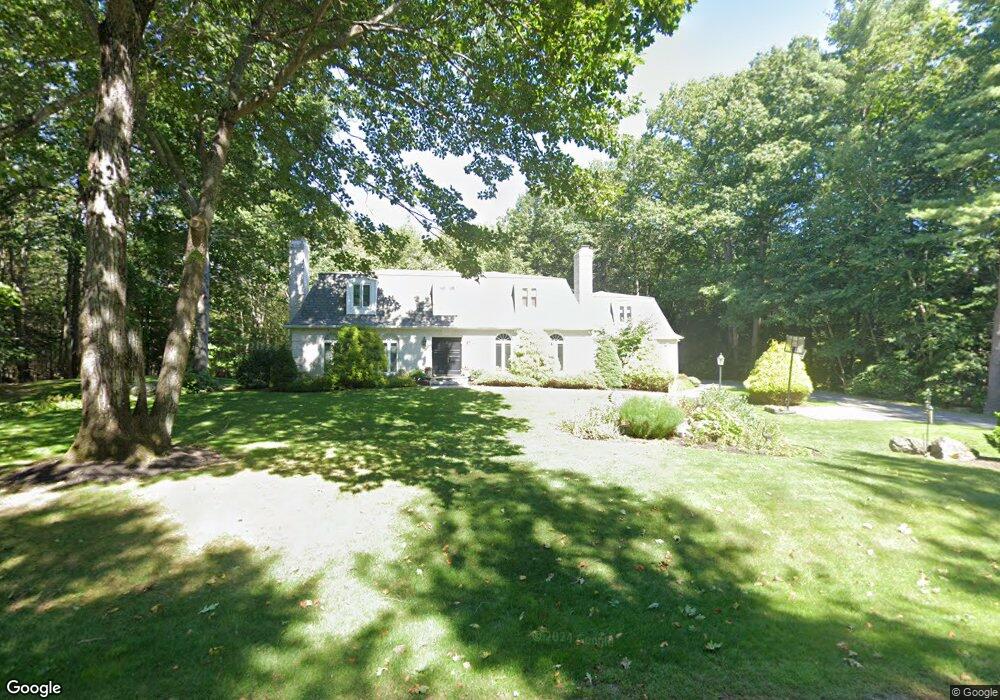
About This Home
This home is located at 12 Pond Path, North Hampton, NH 03862 and is currently estimated at $1,688,195, approximately $478 per square foot. 12 Pond Path is a home with nearby schools including North Hampton School and Winnacunnet High School.
Ownership History
We collect this data history from publicly available records. To have your information removed, we recommend requesting removal directly through your county’s website.
Purchase Details
Home Financials for this Owner
Home Financials are based on the most recent Mortgage that was taken out on this home.Purchase Details
Home Values in the Area
Average Home Value in this Area
Purchase History
We collect this data history from publicly available records. To have your information removed, we recommend requesting removal directly through your county’s website.
| Date | Buyer | Sale Price | Title Company |
|---|---|---|---|
| $665,000 | -- | ||
| $665,000 | -- |
Mortgage History
We collect this data history from publicly available records. To have your information removed, we recommend requesting removal directly through your county’s website.
| Date | Status | Borrower | Loan Amount |
|---|---|---|---|
| Open | $416,400 | ||
| Closed | $75,000 | ||
| Closed | $417,000 | ||
| Closed | $500,000 |
Tax History
We collect this data history from publicly available records. To have your information removed, we recommend requesting removal directly through your county’s website.
| Year | Tax Paid | Tax Assessment Tax Assessment Total Assessment is a certain percentage of the fair market value that is determined by local assessors to be the total taxable value of land and additions on the property. | Land | Improvement |
|---|---|---|---|---|
| 2025 | $15,891 | $1,181,500 | $474,200 | $707,300 |
| 2024 | $15,123 | $1,181,500 | $474,200 | $707,300 |
| 2023 | $14,710 | $1,181,500 | $474,200 | $707,300 |
| 2022 | $13,199 | $768,700 | $255,700 | $513,000 |
| 2021 | $12,570 | $758,600 | $255,700 | $502,900 |
| 2020 | $12,828 | $758,600 | $255,700 | $502,900 |
| 2019 | $12,669 | $758,600 | $255,700 | $502,900 |
| 2018 | $12,320 | $758,600 | $255,700 | $502,900 |
| 2017 | $12,290 | $664,300 | $231,000 | $433,300 |
| 2016 | $11,820 | $664,400 | $231,000 | $433,400 |
| 2015 | $11,614 | $664,400 | $231,000 | $433,400 |
| 2014 | $11,328 | $664,400 | $231,000 | $433,400 |
| 2013 | $11,129 | $664,400 | $231,000 | $433,400 |
Map
- 3-2 South Rd Unit 3-2
- 3-3 South Rd Unit 3-3
- 1 South Rd
- 79 Atlantic Ave
- 495 South Rd
- 12 Willow Ave
- 58 Ocean Blvd
- 197 Mill Rd
- 143 Mill Rd
- 129 Mill Rd
- 8 Shiprock Rd
- 32 Cable Rd Unit 5
- 32 Cable Rd Unit 6
- 32 Cable Rd Unit 4
- 32 Cable Rd Unit 3
- 45 Cable Rd
- 13 Rockrimmon Rd
- 335 Central Rd
- 2 Bayberry Ln
- 20 Huckleberry Ln
Ask me questions while you tour the home.