
Seller's Agent in 2012
Jim Giampa
Carey & Giampa, LLC REALTORS®
(603) 235-5887
97 Total Sales

Estimated Value: $1,499,000 - $2,092,194
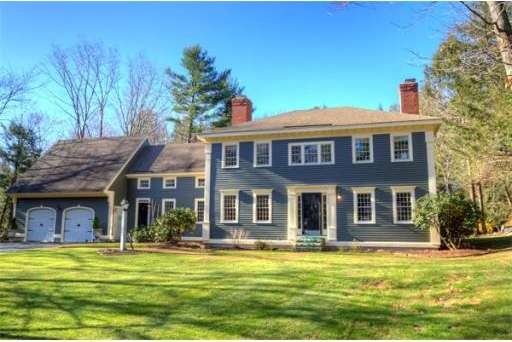
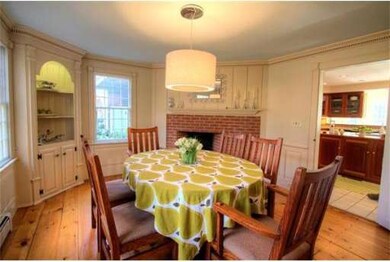
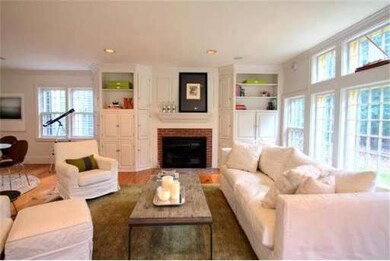
This home is located at 9 Pond Path, North Hampton, NH 03862 since 17 February 2012 and is currently estimated at $1,793,799, approximately $418 per square foot. This property was built in 1984. 9 Pond Path is a home located in Rockingham County with nearby schools including North Hampton School and Winnacunnet High School.
Home Type
Single Family
Year Built
1984
Lot Details
2.1 Acres
We collect this data history from publicly available records. To have your information removed, we recommend requesting removal directly through your county’s website.
We collect this data history from publicly available records. To have your information removed, we recommend requesting removal directly through your county’s website.
| Date | Buyer | Sale Price | Title Company |
|---|---|---|---|
| $780,000 | -- | ||
| $780,000 | -- | ||
| $760,000 | -- | ||
| $760,000 | -- | ||
| $760,000 | -- | ||
| $760,000 | -- | ||
| $625,000 | -- | ||
| $625,000 | -- | ||
| $541,200 | -- | ||
| $541,200 | -- |
We collect this data history from publicly available records. To have your information removed, we recommend requesting removal directly through your county’s website.
| Date | Status | Borrower | Loan Amount |
|---|---|---|---|
| Previous Owner | $523,750 |
We collect this data history from publicly available records. To have your information removed, we recommend requesting removal directly through your county’s website.
| Date | Event | Price | List to Sale | Price per Sq Ft |
|---|---|---|---|---|
| 07/24/2012 07/24/12 | Sold | $780,000 | -5.0% | $182 / Sq Ft |
| 05/27/2012 05/27/12 | Pending | -- | -- | -- |
| 05/14/2012 05/14/12 | Price Changed | $821,000 | -3.3% | $191 / Sq Ft |
| 02/17/2012 02/17/12 | For Sale | $849,000 | -- | $198 / Sq Ft |
We collect this data history from publicly available records. To have your information removed, we recommend requesting removal directly through your county’s website.
| Year | Tax Paid | Tax Assessment Tax Assessment Total Assessment is a certain percentage of the fair market value that is determined by local assessors to be the total taxable value of land and additions on the property. | Land | Improvement |
|---|---|---|---|---|
| 2025 | $17,472 | $1,299,000 | $456,200 | $842,800 |
| 2024 | $16,627 | $1,299,000 | $456,200 | $842,800 |
| 2023 | $16,156 | $1,297,700 | $456,200 | $841,500 |
| 2022 | $14,706 | $856,500 | $246,700 | $609,800 |
| 2021 | $14,192 | $856,500 | $246,700 | $609,800 |
| 2020 | $14,483 | $856,500 | $246,700 | $609,800 |
| 2019 | $14,304 | $856,500 | $246,700 | $609,800 |
| 2018 | $13,910 | $856,500 | $246,700 | $609,800 |
| 2017 | $13,921 | $752,500 | $222,000 | $530,500 |
| 2016 | $13,387 | $752,500 | $222,000 | $530,500 |
| 2015 | $13,154 | $752,500 | $222,000 | $530,500 |
| 2014 | $12,830 | $752,500 | $222,000 | $530,500 |
| 2013 | $12,604 | $752,500 | $222,000 | $530,500 |
Seller's Agent in 2012
Jim Giampa
Carey & Giampa, LLC REALTORS®
(603) 235-5887
97 Total Sales
Source: MLS Property Information Network (MLS PIN)
MLS Number: 71377835
APN: NHTN-000005-000089-000009
Disclaimer: Certain information contained herein is derived from information provided by parties other than Homes.com. All information provided is deemed reliable, but is not guaranteed to be accurate and should be independently verified.
![]() The property listing data and information, or the Images, set forth herein were provided to MLS Property Information Network, Inc. from third party sources, including sellers, lessors and public records, and were compiled by MLS Property Information Network, Inc. The property listing data and information, and the Images, are for the personal, non-commercial use of consumers having a good faith interest in purchasing or leasing listed properties of the type displayed to them and may not be used for any purpose other than to identify prospective properties which such consumers may have a good faith interest in purchasing or leasing. MLS Property Information Network, Inc. and its subscribers disclaim any and all representations and warranties as to the accuracy of the property listing data and information, or as to the accuracy of any of the Images, set forth herein.
The property listing data and information, or the Images, set forth herein were provided to MLS Property Information Network, Inc. from third party sources, including sellers, lessors and public records, and were compiled by MLS Property Information Network, Inc. The property listing data and information, and the Images, are for the personal, non-commercial use of consumers having a good faith interest in purchasing or leasing listed properties of the type displayed to them and may not be used for any purpose other than to identify prospective properties which such consumers may have a good faith interest in purchasing or leasing. MLS Property Information Network, Inc. and its subscribers disclaim any and all representations and warranties as to the accuracy of the property listing data and information, or as to the accuracy of any of the Images, set forth herein.
Ask me questions while you tour the home.