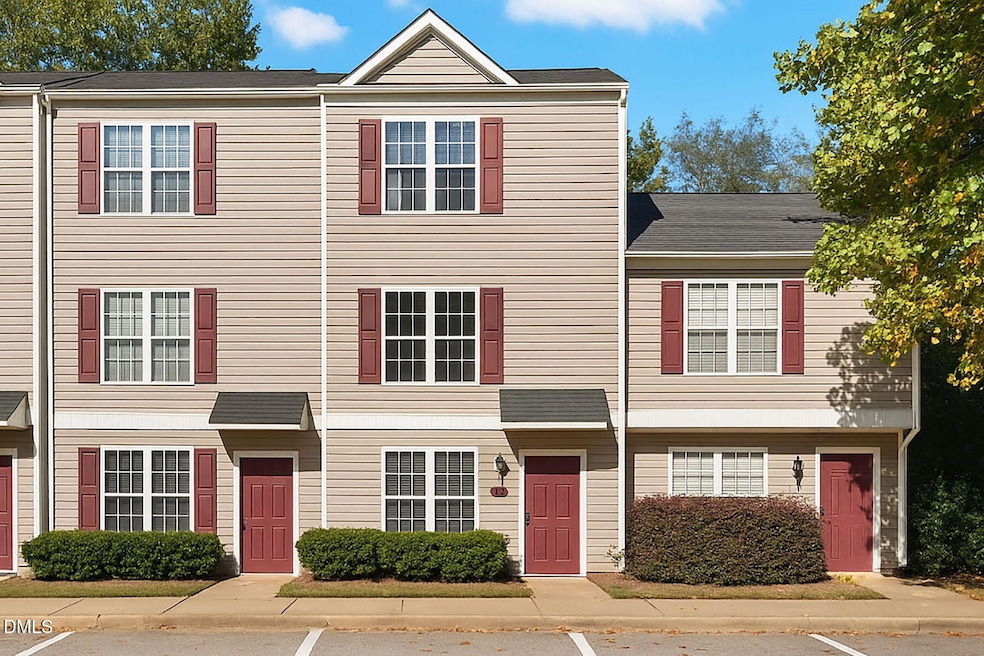
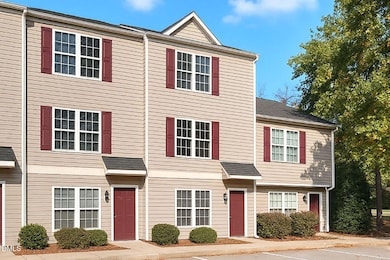
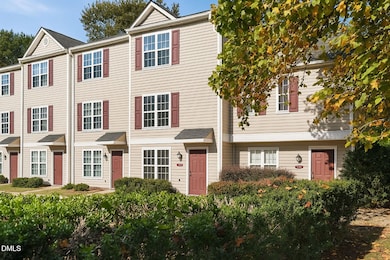
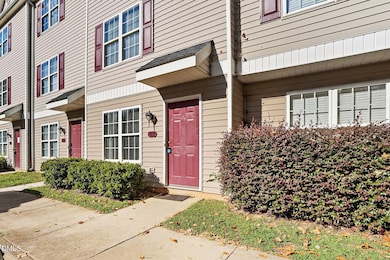
12 Red Ln Raleigh, NC 27606
Estimated payment $1,808/month
Highlights
- Traditional Architecture
- Cooling Available
- Tile Flooring
- Farmington Woods Elementary Rated A
- Living Room
- Heating Available
About This Home
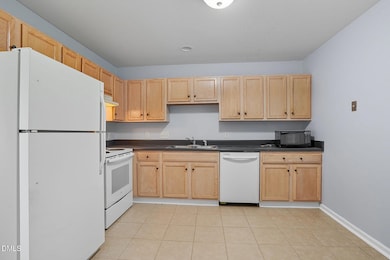
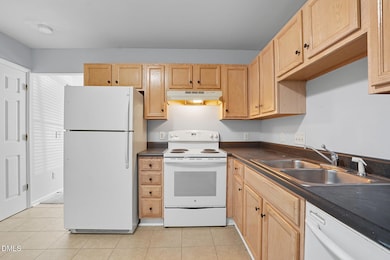
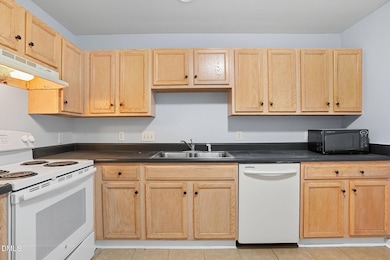
Conveniently located near NC State and just minutes to I-440, this spacious 3-story townhouse offers comfort, privacy, and modern updates. Each of the 3 bedrooms features its own private full bathroom, providing an ideal layout for residents or roommates. A half bathroom on the main level adds extra convenience for guests. The home includes updated carpet throughout, a bright and open main living area, and a water purification system for added peace of mind. With its functional floor plan and prime location close to campus, shopping, and major highways, this property is move-in ready and full of potential.
Townhouse Details
Home Type
- Townhome
Est. Annual Taxes
- $2,185
Year Built
- Built in 2002
Lot Details
- 871 Sq Ft Lot
HOA Fees
- $150 Monthly HOA Fees
Home Design
- Traditional Architecture
- Slab Foundation
- Shingle Roof
- Vinyl Siding
Interior Spaces
- 1,371 Sq Ft Home
- 3-Story Property
- Living Room
Flooring
- Carpet
- Laminate
- Tile
Bedrooms and Bathrooms
- 3 Bedrooms
- Primary bedroom located on second floor
Parking
- 2 Parking Spaces
- 2 Open Parking Spaces
Schools
- Farmington Woods Elementary School
- Martin Middle School
- Athens Dr High School
Utilities
- Cooling Available
- Heating Available
Community Details
- Association fees include ground maintenance, road maintenance, snow removal, trash
- Red Wolf Crossing HOA, Phone Number (305) 422-9818
- Red Wolf Crossing Subdivision
Listing and Financial Details
- Assessor Parcel Number 0301151
Map
Home Values in the Area
Average Home Value in this Area
Tax History
| Year | Tax Paid | Tax Assessment Tax Assessment Total Assessment is a certain percentage of the fair market value that is determined by local assessors to be the total taxable value of land and additions on the property. | Land | Improvement |
|---|---|---|---|---|
| 2025 | $2,185 | $248,242 | $55,000 | $193,242 |
| 2024 | $2,176 | $248,242 | $55,000 | $193,242 |
| 2023 | $1,746 | $158,332 | $38,000 | $120,332 |
| 2022 | $1,623 | $158,332 | $38,000 | $120,332 |
| 2021 | $1,561 | $158,332 | $38,000 | $120,332 |
| 2020 | $1,532 | $158,332 | $38,000 | $120,332 |
| 2019 | $1,447 | $123,092 | $28,000 | $95,092 |
| 2018 | $1,365 | $123,092 | $28,000 | $95,092 |
| 2017 | $1,301 | $123,092 | $28,000 | $95,092 |
| 2016 | $1,274 | $123,092 | $28,000 | $95,092 |
| 2015 | $1,229 | $116,786 | $22,000 | $94,786 |
| 2014 | $1,167 | $116,786 | $22,000 | $94,786 |
Property History
| Date | Event | Price | List to Sale | Price per Sq Ft |
|---|---|---|---|---|
| 09/24/2025 09/24/25 | For Sale | $280,000 | -- | $204 / Sq Ft |
Purchase History
| Date | Type | Sale Price | Title Company |
|---|---|---|---|
| Warranty Deed | $116,000 | None Available | |
| Warranty Deed | $113,000 | None Available | |
| Warranty Deed | $114,000 | -- |
Mortgage History
| Date | Status | Loan Amount | Loan Type |
|---|---|---|---|
| Open | $104,400 | Unknown | |
| Previous Owner | $90,000 | Fannie Mae Freddie Mac | |
| Previous Owner | $91,100 | Balloon |
Source: Doorify MLS
MLS Number: 10123625
APN: 0784.17-10-5858-000
Disclaimer: Certain information contained herein is derived from information provided by parties other than Homes.com. All information provided is deemed reliable, but is not guaranteed to be accurate and should be independently verified.
![]() Some IDX listings have been excluded from this IDX display. Brokers make an effort to deliver accurate information, but buyers should independently verify any information on which they will rely in a transaction. The listing broker shall not be responsible for any typographical errors, misinformation, or misprints, and they shall be held totally harmless from any damages arising from reliance upon this data. This data is provided exclusively for consumers’ personal, non-commercial use. Listings marked with an icon are provided courtesy of the Doorify MLS, Inc. of North Carolina, Internet Data Exchange Database. Closed (sold) listings may have been listed and/or sold by a real estate firm other than the firm(s) featured on this website. Closed data is not available until the sale of the property is recorded in the MLS. Home sale data is not an appraisal, CMA, competitive or comparative market analysis, or home valuation of any property. Copyright 2025 Doorify MLS, Inc. of North Carolina. All rights reserved.
Some IDX listings have been excluded from this IDX display. Brokers make an effort to deliver accurate information, but buyers should independently verify any information on which they will rely in a transaction. The listing broker shall not be responsible for any typographical errors, misinformation, or misprints, and they shall be held totally harmless from any damages arising from reliance upon this data. This data is provided exclusively for consumers’ personal, non-commercial use. Listings marked with an icon are provided courtesy of the Doorify MLS, Inc. of North Carolina, Internet Data Exchange Database. Closed (sold) listings may have been listed and/or sold by a real estate firm other than the firm(s) featured on this website. Closed data is not available until the sale of the property is recorded in the MLS. Home sale data is not an appraisal, CMA, competitive or comparative market analysis, or home valuation of any property. Copyright 2025 Doorify MLS, Inc. of North Carolina. All rights reserved.
- 67 Red Ln
- 2027 Oakdale Dr
- 2003 Oakdale Dr
- 4818 Blue Bird Ct Unit C
- 5257 Vann St
- 4810 Blue Bird Ct Unit B
- 4812 Blue Bird Ct Unit C
- 330 Wilmot Dr
- 2116 Scarlet Maple Dr
- 2114 Scarlet Maple Dr
- 5061 Lundy Dr Unit 101
- 551 Oak Run Dr
- 5045 Lundy Dr Unit 101
- 522 Oak Run Dr Unit 87
- 5406 Merritt St
- 9 Powell Dr
- 618 Powell Dr
- 700 Grayhaven Place
- 722 Powell Dr
- 724 Powell Dr
- 15 Red Ln
- 23 Red Ln
- 53 Red Ln
- 5701 Hillsborough St
- 201 Buck Jones Rd
- 10 Oakdale Dr
- 119 Wilmot Dr
- 100-D-150 Hunt Club Ln
- 4706 Blue Bird Ct Unit I
- 403 Wolf Creek Cir
- 323 Wilmot Dr
- 705 Carolina Ave Unit 102
- 711 Carolina Ave Unit 101
- 5400 Portree Place
- 5211 Deer Haven Dr
- 5126 Lundy Dr
- 220 Marsh Ave
- 5300 Grovewood Place
- 821 Hanbury Way
- 821 Hanbury Way Unit A1
