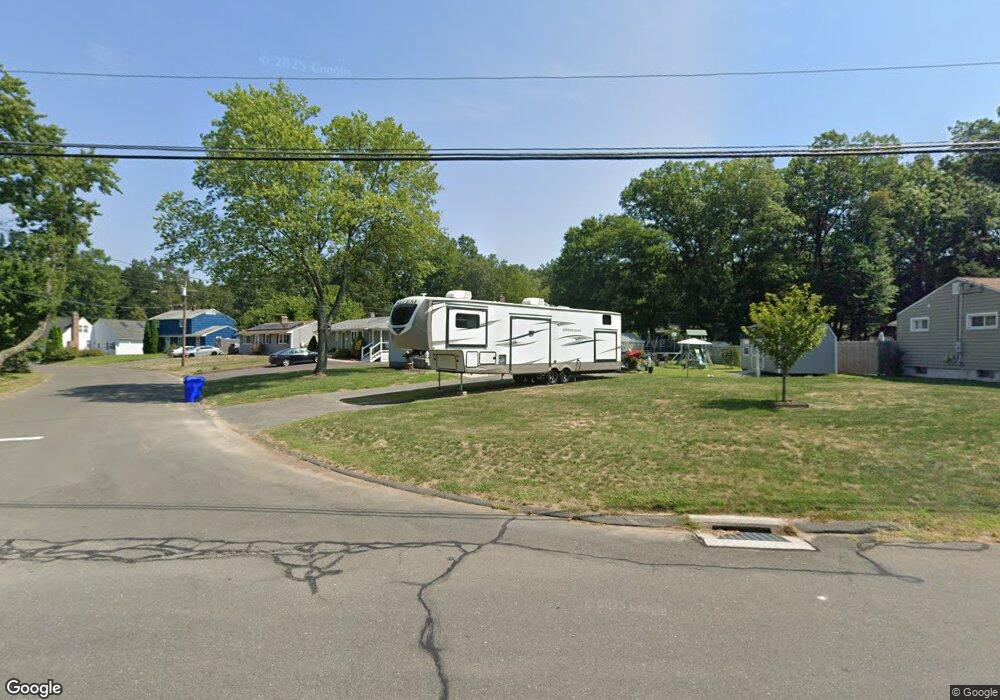
12 Robbin Rd Enfield, CT 06082
Estimated Value: $252,307 - $303,000
3
Beds
1
Bath
920
Sq Ft
$307/Sq Ft
Est. Value
About This Home
This home is located at 12 Robbin Rd, Enfield, CT 06082 and is currently estimated at $282,077, approximately $306 per square foot. 12 Robbin Rd is a home located in Hartford County with nearby schools including Prudence Crandall Elementary School, Henry Barnard Elementary School, and Enfield High School.
Ownership History
Date
Name
Owned For
Owner Type
Purchase Details
Closed on
Jun 28, 2021
Sold by
Cooley Anna L
Bought by
Dealba Laura L
Current Estimated Value
Home Financials for this Owner
Home Financials are based on the most recent Mortgage that was taken out on this home.
Original Mortgage
$144,993
Outstanding Balance
$130,124
Interest Rate
2.9%
Mortgage Type
FHA
Estimated Equity
$151,953
Purchase Details
Closed on
Apr 17, 2017
Sold by
Cooley Anna L
Bought by
Dealba Laura L and Cooley Anna L
Purchase Details
Closed on
Nov 3, 1998
Sold by
Whiddon Pamela
Bought by
Cooley Leon
Purchase Details
Closed on
Aug 11, 1997
Sold by
Bezanker Paul and Bezanker Carol
Bought by
Whiddon Pamela
Create a Home Valuation Report for This Property
The Home Valuation Report is an in-depth analysis detailing your home's value as well as a comparison with similar homes in the area
Home Values in the Area
Average Home Value in this Area
Purchase History
| Date | Buyer | Sale Price | Title Company |
|---|---|---|---|
| Dealba Laura L | -- | None Available | |
| Dealba Laura L | -- | None Available | |
| Dealba Laura L | -- | -- | |
| Cooley Leon | $93,000 | -- | |
| Whiddon Pamela | $81,000 | -- | |
| Dealba Laura L | -- | -- | |
| Cooley Leon | $93,000 | -- | |
| Whiddon Pamela | $81,000 | -- |
Source: Public Records
Mortgage History
| Date | Status | Borrower | Loan Amount |
|---|---|---|---|
| Open | Dealba Laura L | $144,993 | |
| Previous Owner | Whiddon Pamela | $17,206 |
Source: Public Records
Tax History
| Year | Tax Paid | Tax Assessment Tax Assessment Total Assessment is a certain percentage of the fair market value that is determined by local assessors to be the total taxable value of land and additions on the property. | Land | Improvement |
|---|---|---|---|---|
| 2025 | $4,155 | $119,900 | $49,700 | $70,200 |
| 2024 | $4,054 | $119,900 | $49,700 | $70,200 |
| 2023 | $3,988 | $119,900 | $49,700 | $70,200 |
| 2022 | $3,668 | $119,900 | $49,700 | $70,200 |
| 2021 | $3,371 | $90,180 | $39,220 | $50,960 |
| 2020 | $3,371 | $90,180 | $39,220 | $50,960 |
| 2019 | $3,371 | $90,180 | $39,220 | $50,960 |
| 2018 | $3,296 | $90,180 | $39,220 | $50,960 |
| 2017 | $3,118 | $90,180 | $39,220 | $50,960 |
| 2016 | $3,183 | $93,600 | $43,930 | $49,670 |
| 2015 | $3,093 | $93,600 | $43,930 | $49,670 |
| 2014 | $3,021 | $93,600 | $43,930 | $49,670 |
Source: Public Records
Map
Nearby Homes
- 449 The Meadows
- 56 Liberty Ln
- 46 Liberty Ln
- 43 Liberty Ln
- 41 Liberty Ln
- 39 Liberty Ln
- 54 Liberty Ln
- 59 Liberty Ln
- 44 Liberty Ln
- 60 Liberty Ln
- 42 Liberty Ln
- 50 Liberty Ln
- 50 Roosevelt Blvd
- 357 Maple Rd
- 79 Roosevelt Blvd
- 31 Sharren Ln
- 302 Ashmead Commons Unit 302
- 141 Lincoln Rd
- 53 Meadowlark Dr
- 63 Meadowlark Dr
Your Personal Tour Guide
Ask me questions while you tour the home.