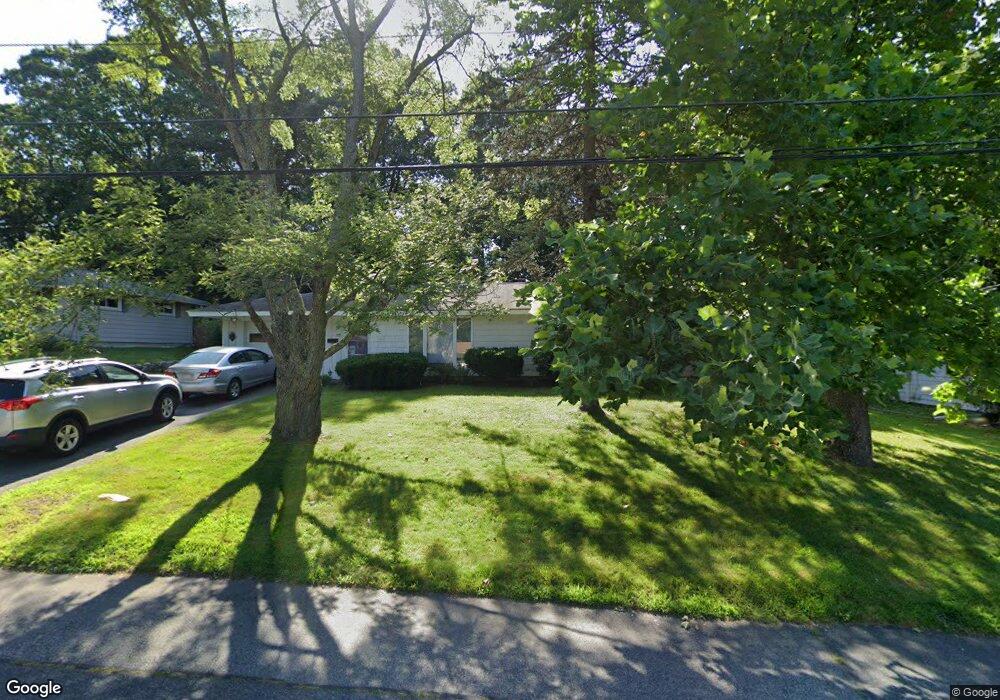
12 Saybrook Rd Framingham, MA 01701
Estimated Value: $550,826 - $588,000
3
Beds
2
Baths
1,056
Sq Ft
$542/Sq Ft
Est. Value
About This Home
This home is located at 12 Saybrook Rd, Framingham, MA 01701 and is currently estimated at $572,707, approximately $542 per square foot. 12 Saybrook Rd is a home located in Middlesex County with nearby schools including Framingham High School, Christa McAuliffe Charter School, and Happy Hollow School.
Ownership History
Date
Name
Owned For
Owner Type
Purchase Details
Closed on
Dec 23, 2020
Sold by
Brener Roberta
Bought by
Brener Jeffrey D
Current Estimated Value
Purchase Details
Closed on
Jul 19, 2000
Sold by
Rich Harry W and Rich Linda K
Bought by
Brener Robert W and Brener Roberta
Home Financials for this Owner
Home Financials are based on the most recent Mortgage that was taken out on this home.
Original Mortgage
$177,600
Interest Rate
8.28%
Mortgage Type
Purchase Money Mortgage
Purchase Details
Closed on
Dec 22, 1995
Sold by
Armstrong Thomas J
Bought by
Rich Harry W and Rich Linda K
Purchase Details
Closed on
Jan 22, 1993
Sold by
Est Morris Ruth and Morris Thomas J
Bought by
Armstrong Thomas J
Purchase Details
Closed on
Apr 14, 1989
Sold by
Morris Thomas
Bought by
Morris Ruth L
Create a Home Valuation Report for This Property
The Home Valuation Report is an in-depth analysis detailing your home's value as well as a comparison with similar homes in the area
Home Values in the Area
Average Home Value in this Area
Purchase History
| Date | Buyer | Sale Price | Title Company |
|---|---|---|---|
| Brener Jeffrey D | -- | None Available | |
| Brener Jeffrey D | -- | None Available | |
| Brener Robert W | $200,000 | -- | |
| Rich Harry W | $120,500 | -- | |
| Rich Harry W | $120,500 | -- | |
| Armstrong Thomas J | $122,500 | -- | |
| Armstrong Thomas J | $122,500 | -- | |
| Morris Ruth L | $15,000 | -- | |
| Morris Ruth L | $15,000 | -- |
Source: Public Records
Mortgage History
| Date | Status | Borrower | Loan Amount |
|---|---|---|---|
| Previous Owner | Morris Ruth L | $241,000 | |
| Previous Owner | Morris Ruth L | $177,600 |
Source: Public Records
Tax History Compared to Growth
Tax History
| Year | Tax Paid | Tax Assessment Tax Assessment Total Assessment is a certain percentage of the fair market value that is determined by local assessors to be the total taxable value of land and additions on the property. | Land | Improvement |
|---|---|---|---|---|
| 2025 | $5,558 | $465,500 | $262,300 | $203,200 |
| 2024 | $5,286 | $424,200 | $234,200 | $190,000 |
| 2023 | $5,015 | $383,100 | $209,000 | $174,100 |
| 2022 | $4,711 | $342,900 | $189,700 | $153,200 |
| 2021 | $4,596 | $327,100 | $182,300 | $144,800 |
| 2020 | $4,548 | $303,600 | $165,700 | $137,900 |
| 2019 | $4,502 | $292,700 | $165,700 | $127,000 |
| 2018 | $4,431 | $271,500 | $159,500 | $112,000 |
| 2017 | $4,341 | $259,800 | $154,800 | $105,000 |
| 2016 | $4,267 | $245,500 | $154,800 | $90,700 |
| 2015 | $4,177 | $234,400 | $154,800 | $79,600 |
Source: Public Records
Map
Nearby Homes
- 144 Old Connecticut Path
- 11 Longview Rd
- 30 Morse Rd
- 194 Beacon St
- 145 Beacon St
- 92 Old Connecticut Path
- 27 Joclyn Ave
- 8 Old Conn Path
- 52 Lohnes Rd
- 30 Donlon St
- 15 Haynes Rd
- 109 Hastings St
- 33 Highgate Rd
- 12 Bryant Rd
- 29 Aberdeen Rd
- 447 Old Connecticut Path
- 4 Mclaughlin St Unit 3
- 31 Palmer Rd
- 204 Hartford St
- 17 Lilian Rd