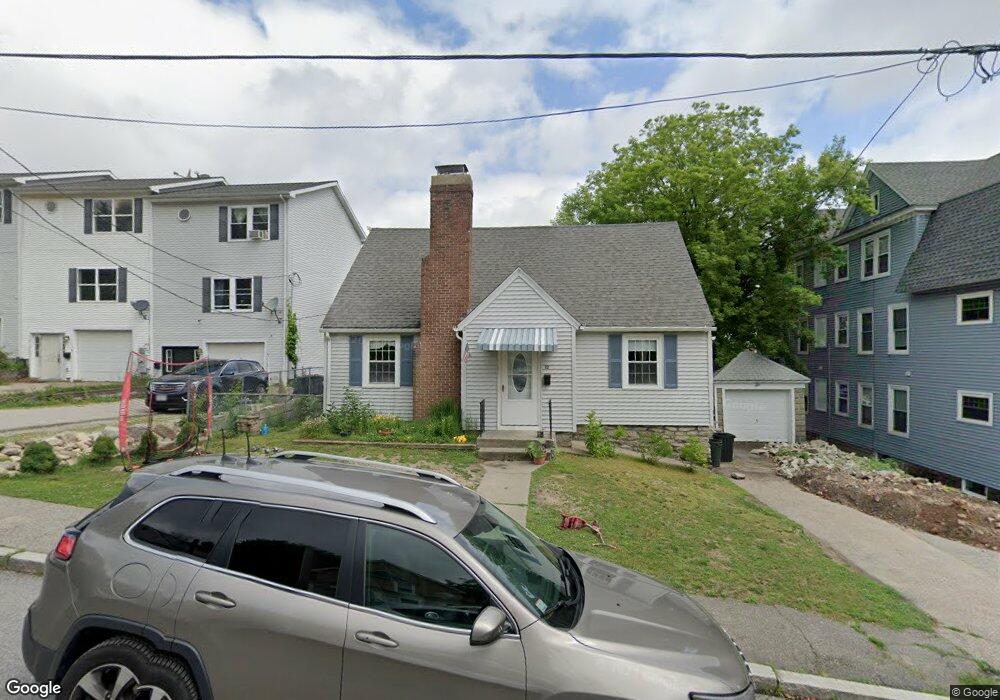
12 Sherburne Ave Worcester, MA 01606
Indian Lake East NeighborhoodEstimated Value: $390,000 - $466,000
3
Beds
2
Baths
1,524
Sq Ft
$280/Sq Ft
Est. Value
About This Home
This home is located at 12 Sherburne Ave, Worcester, MA 01606 and is currently estimated at $427,247, approximately $280 per square foot. 12 Sherburne Ave is a home located in Worcester County with nearby schools including Francis J. McGrath Elementary School, Jacob Hiatt Magnet School, and Chandler Magnet.
Ownership History
Date
Name
Owned For
Owner Type
Purchase Details
Closed on
Sep 16, 2013
Sold by
Daley Kevin L
Bought by
Daley Sean
Current Estimated Value
Home Financials for this Owner
Home Financials are based on the most recent Mortgage that was taken out on this home.
Original Mortgage
$196,377
Outstanding Balance
$142,117
Interest Rate
4.5%
Mortgage Type
FHA
Estimated Equity
$285,130
Create a Home Valuation Report for This Property
The Home Valuation Report is an in-depth analysis detailing your home's value as well as a comparison with similar homes in the area
Home Values in the Area
Average Home Value in this Area
Purchase History
| Date | Buyer | Sale Price | Title Company |
|---|---|---|---|
| Daley Sean | $200,000 | -- |
Source: Public Records
Mortgage History
| Date | Status | Borrower | Loan Amount |
|---|---|---|---|
| Open | Daley Sean | $196,377 |
Source: Public Records
Tax History
| Year | Tax Paid | Tax Assessment Tax Assessment Total Assessment is a certain percentage of the fair market value that is determined by local assessors to be the total taxable value of land and additions on the property. | Land | Improvement |
|---|---|---|---|---|
| 2025 | $4,810 | $364,700 | $114,100 | $250,600 |
| 2024 | $4,731 | $344,100 | $114,100 | $230,000 |
| 2023 | $4,547 | $317,100 | $99,200 | $217,900 |
| 2022 | $4,192 | $275,600 | $79,400 | $196,200 |
| 2021 | $4,052 | $248,900 | $63,500 | $185,400 |
| 2020 | $3,968 | $233,400 | $63,500 | $169,900 |
| 2019 | $3,798 | $211,000 | $57,100 | $153,900 |
| 2018 | $3,818 | $201,900 | $57,100 | $144,800 |
| 2017 | $3,675 | $191,200 | $57,100 | $134,100 |
| 2016 | $3,631 | $176,200 | $42,100 | $134,100 |
| 2015 | $3,536 | $176,200 | $42,100 | $134,100 |
| 2014 | $3,443 | $176,200 | $42,100 | $134,100 |
Source: Public Records
Map
Nearby Homes
- 44 Boardman St
- 31 Boardman St
- 15 Boardman St
- 15 Ericsson St
- 18 Gosnold St
- 6 Roald St
- 6 Ashburnham Rd
- 577 Grove St
- 39 Whitmarsh Ave
- 100 Burncoat St
- 82 Holden St
- 94 Kendrick Ave
- 14 Balder Rd
- 25 Chester St
- 169 Whitmarsh Ave
- 10 Dryden St Unit 7
- 20B Edgeworth St
- 63 North St Unit D
- 63 North St Unit C
- 63 North St Unit B
- 14 Sherburne Ave
- 10 Sherburne Ave
- 10 Sherburne Ave Unit 1
- 10 Sherburne Ave Unit 2
- 10 Sherburne Ave Unit 3
- 16 Sherburne Ave
- 18 Sherburne Ave
- 5 Clason Rd
- 7 Clason Rd
- 3 Clason Rd
- 29 Sherburne Ave
- 22 Sherburne Ave
- 55 W Boylston Dr
- 15 Sherburne Ave
- 9 Clason Rd
- 9 Sherburne Ave
- 1 Clason Rd
- 19 Sherburne Ave
- 7 Sherburne Ave
- 24 Sherburne Ave
Your Personal Tour Guide
Ask me questions while you tour the home.