12 Sparkle St Enfield, CT 06082
Estimated Value: $376,152 - $432,000
4
Beds
2
Baths
1,884
Sq Ft
$213/Sq Ft
Est. Value
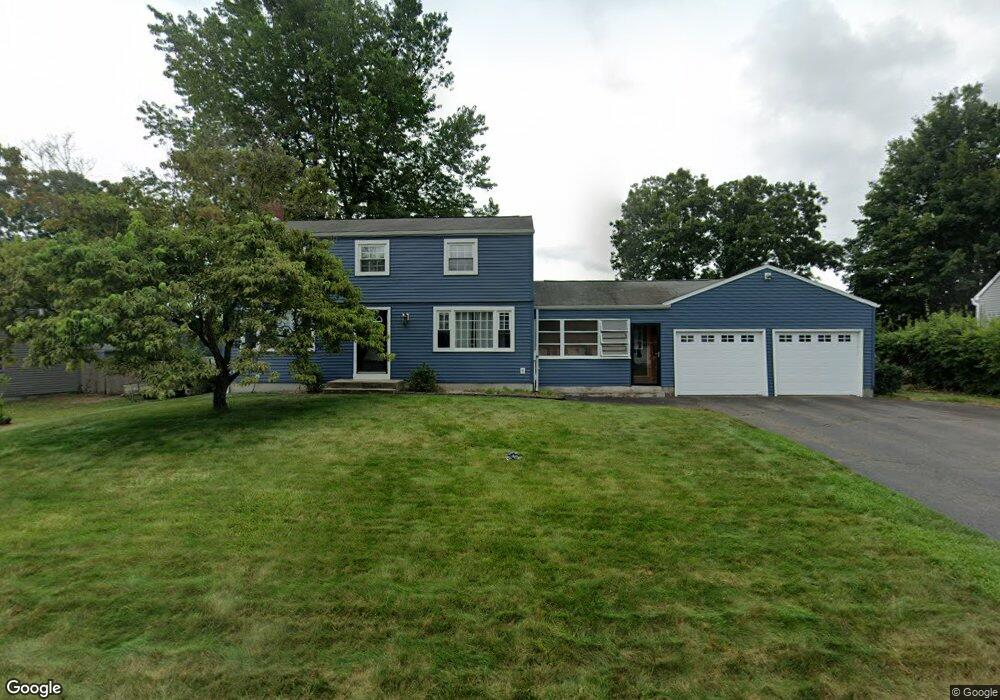
About This Home
This home is located at 12 Sparkle St, Enfield, CT 06082 and is currently estimated at $401,288, approximately $212 per square foot. 12 Sparkle St is a home located in Hartford County with nearby schools including Eli Whitney Elementary School, Hazardville Memorial Elementary School, and John F. Kennedy Middle School.
Ownership History
Date
Name
Owned For
Owner Type
Purchase Details
Closed on
Aug 9, 2002
Sold by
Lemieux Robert and Lemieux Ann
Bought by
Waterman Daniel and Waterman Tina
Current Estimated Value
Purchase Details
Closed on
Dec 22, 1999
Sold by
Reynolds Robert and Reynolds Bernice
Bought by
Lemieux Robert and Lemieux Ann
Create a Home Valuation Report for This Property
The Home Valuation Report is an in-depth analysis detailing your home's value as well as a comparison with similar homes in the area
Home Values in the Area
Average Home Value in this Area
Purchase History
| Date | Buyer | Sale Price | Title Company |
|---|---|---|---|
| Waterman Daniel | $213,000 | -- | |
| Lemieux Robert | $150,000 | -- |
Source: Public Records
Mortgage History
| Date | Status | Borrower | Loan Amount |
|---|---|---|---|
| Open | Lemieux Robert | $198,616 | |
| Closed | Lemieux Robert | $204,110 |
Source: Public Records
Tax History Compared to Growth
Tax History
| Year | Tax Paid | Tax Assessment Tax Assessment Total Assessment is a certain percentage of the fair market value that is determined by local assessors to be the total taxable value of land and additions on the property. | Land | Improvement |
|---|---|---|---|---|
| 2025 | $6,344 | $181,300 | $59,100 | $122,200 |
| 2024 | $6,173 | $181,300 | $59,100 | $122,200 |
| 2023 | $6,128 | $181,300 | $59,100 | $122,200 |
| 2022 | $5,564 | $181,300 | $59,100 | $122,200 |
| 2021 | $5,714 | $152,240 | $53,000 | $99,240 |
| 2020 | $5,714 | $152,240 | $53,000 | $99,240 |
| 2019 | $5,729 | $152,240 | $53,000 | $99,240 |
| 2018 | $5,633 | $152,240 | $53,000 | $99,240 |
| 2017 | $5,318 | $152,240 | $53,000 | $99,240 |
| 2016 | $4,639 | $135,200 | $46,890 | $88,310 |
| 2015 | $2,553 | $135,200 | $46,890 | $88,310 |
| 2014 | $4,378 | $135,200 | $46,890 | $88,310 |
Source: Public Records
Map
Nearby Homes