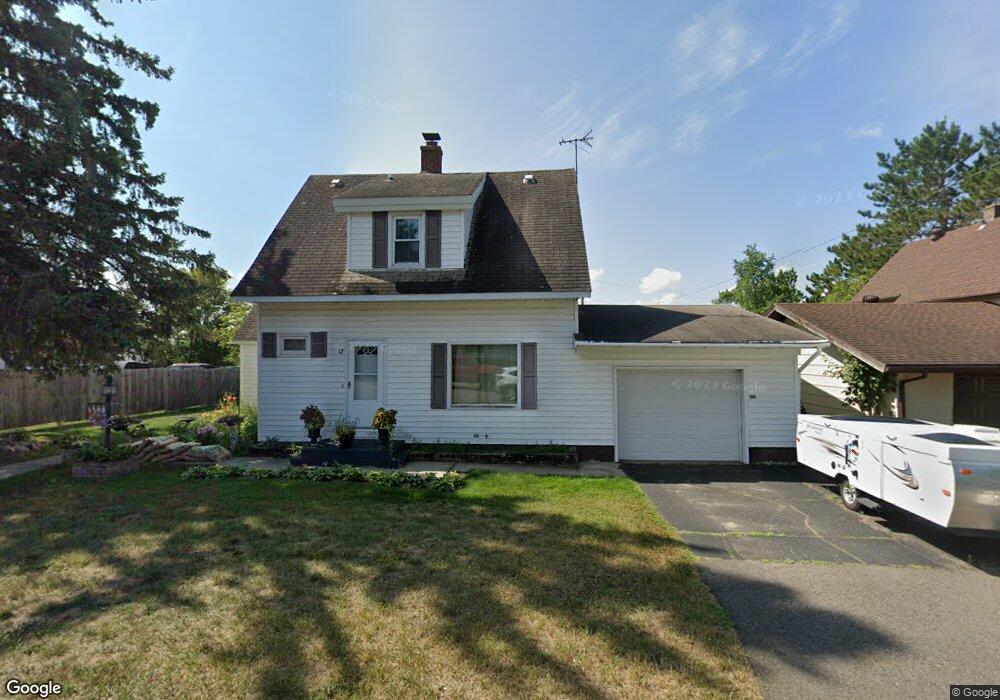
12 Superior St Soudan, MN 55782
Soudan NeighborhoodEstimated Value: $100,000 - $108,000
2
Beds
2
Baths
946
Sq Ft
$111/Sq Ft
Est. Value
About This Home
This home is located at 12 Superior St, Soudan, MN 55782 and is currently estimated at $104,567, approximately $110 per square foot. 12 Superior St is a home located in St. Louis County with nearby schools including Tower-Soudan Elementary School and Vermilion Country School.
Ownership History
Date
Name
Owned For
Owner Type
Purchase Details
Closed on
Jul 21, 2011
Sold by
Pnc Bank National Association
Bought by
Winkler Randy and Laforte Joseph
Current Estimated Value
Purchase Details
Closed on
Aug 6, 2009
Sold by
Lamphier Blaine A
Bought by
National City Bank
Purchase Details
Closed on
Apr 23, 2007
Sold by
Mattson Kenneth A and Mattson Barbara A
Bought by
Lamphier Blaine Anthony
Home Financials for this Owner
Home Financials are based on the most recent Mortgage that was taken out on this home.
Original Mortgage
$65,484
Interest Rate
6.21%
Mortgage Type
Purchase Money Mortgage
Create a Home Valuation Report for This Property
The Home Valuation Report is an in-depth analysis detailing your home's value as well as a comparison with similar homes in the area
Home Values in the Area
Average Home Value in this Area
Purchase History
We collect this data history from publicly available records. To have your information removed, we recommend requesting removal directly through your county’s website.
| Date | Buyer | Sale Price | Title Company |
|---|---|---|---|
| Winkler Randy | $22,500 | Dca Title | |
| National City Bank | $68,970 | None Available | |
| Lamphier Blaine Anthony | $63,493 | Northeast Title Company | |
| Mattson Kenneth A | -- | Northeast Title Company |
Source: Public Records
Mortgage History
We collect this data history from publicly available records. To have your information removed, we recommend requesting removal directly through your county’s website.
| Date | Status | Borrower | Loan Amount |
|---|---|---|---|
| Previous Owner | Lamphier Blaine Anthony | $65,484 |
Source: Public Records
Tax History
| Year | Tax Paid | Tax Assessment Tax Assessment Total Assessment is a certain percentage of the fair market value that is determined by local assessors to be the total taxable value of land and additions on the property. | Land | Improvement |
|---|---|---|---|---|
| 2024 | $304 | $64,900 | $8,200 | $56,700 |
| 2023 | $252 | $67,100 | $8,200 | $58,900 |
| 2022 | $830 | $56,300 | $7,800 | $48,500 |
| 2021 | $826 | $53,600 | $7,300 | $46,300 |
| 2020 | $792 | $53,600 | $7,300 | $46,300 |
| 2019 | $658 | $51,000 | $7,300 | $43,700 |
| 2018 | $580 | $44,000 | $6,900 | $37,100 |
| 2017 | $550 | $38,400 | $6,300 | $32,100 |
| 2016 | $554 | $36,400 | $5,800 | $30,600 |
| 2015 | $540 | $32,800 | $5,800 | $27,000 |
| 2014 | $540 | $34,400 | $5,800 | $28,600 |
Source: Public Records
Map
Nearby Homes
Your Personal Tour Guide
Ask me questions while you tour the home.