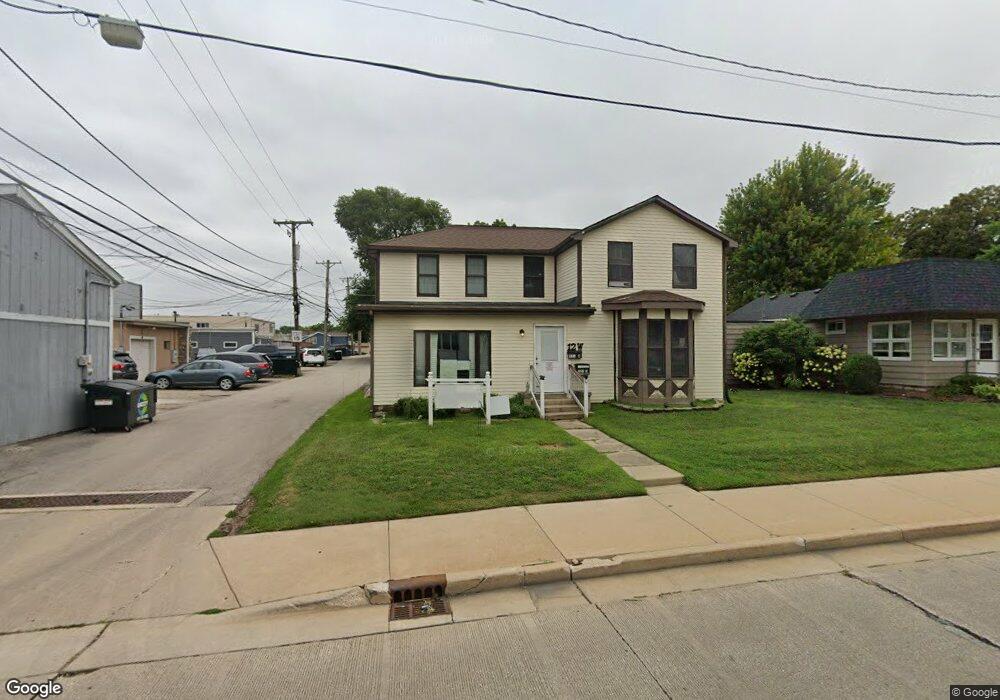
12 W Washington St Oswego, IL 60543
Downtown Oswego Neighborhood
--
Bed
--
Bath
--
Sq Ft
5,663
Sq Ft Lot
About This Home
This home is located at 12 W Washington St, Oswego, IL 60543. 12 W Washington St is a home located in Kendall County with nearby schools including Southbury Elementary School, Traughber Junior High School, and Oswego High School.
Ownership History
Date
Name
Owned For
Owner Type
Purchase Details
Closed on
Mar 28, 2011
Sold by
Old Second National Bank
Bought by
Massie Lowell
Home Financials for this Owner
Home Financials are based on the most recent Mortgage that was taken out on this home.
Original Mortgage
$37,100
Outstanding Balance
$25,822
Interest Rate
4.99%
Mortgage Type
Commercial
Purchase Details
Closed on
Oct 26, 2010
Sold by
Patterman Steve
Bought by
Old Second National Bank
Purchase Details
Closed on
Oct 26, 2004
Sold by
Patterman Builders Inc
Bought by
Pattermann Steve
Purchase Details
Closed on
Apr 26, 2004
Sold by
Rygiewicz Robert F
Bought by
Pattermann Builders Inc
Purchase Details
Closed on
May 1, 1994
Bought by
Rygiewicz Robert F
Purchase Details
Closed on
Jun 1, 1990
Bought by
Detzler James and Secor Jerry
Purchase Details
Closed on
Dec 1, 1984
Create a Home Valuation Report for This Property
The Home Valuation Report is an in-depth analysis detailing your home's value as well as a comparison with similar homes in the area
Home Values in the Area
Average Home Value in this Area
Purchase History
| Date | Buyer | Sale Price | Title Company |
|---|---|---|---|
| Massie Lowell | $53,000 | Chicago Title Insurance Co | |
| Old Second National Bank | -- | None Available | |
| Pattermann Steve | -- | None Available | |
| Pattermann Builders Inc | $175,000 | Wheatland Title | |
| Rygiewicz Robert F | $119,000 | -- | |
| Detzler James | $85,000 | -- | |
| -- | -- | -- |
Source: Public Records
Mortgage History
| Date | Status | Borrower | Loan Amount |
|---|---|---|---|
| Open | Massie Lowell | $37,100 | |
| Closed | Detzler James | -- | |
| Closed | Pattermann Builders Inc | $0 |
Source: Public Records
Tax History Compared to Growth
Tax History
| Year | Tax Paid | Tax Assessment Tax Assessment Total Assessment is a certain percentage of the fair market value that is determined by local assessors to be the total taxable value of land and additions on the property. | Land | Improvement |
|---|---|---|---|---|
| 2024 | $4,939 | $61,379 | $23,848 | $37,531 |
| 2023 | $5,543 | $61,379 | $23,848 | $37,531 |
| 2022 | $5,543 | $61,379 | $23,848 | $37,531 |
| 2021 | $5,743 | $61,379 | $23,848 | $37,531 |
| 2020 | $5,800 | $61,379 | $23,848 | $37,531 |
| 2019 | $5,892 | $61,379 | $23,848 | $37,531 |
| 2018 | $5,014 | $49,529 | $13,720 | $35,809 |
| 2017 | $5,077 | $49,529 | $13,720 | $35,809 |
| 2016 | $5,152 | $49,529 | $13,720 | $35,809 |
| 2015 | $5,403 | $49,529 | $13,720 | $35,809 |
| 2014 | $2,828 | $49,529 | $13,720 | $35,809 |
| 2013 | $2,828 | $49,529 | $13,720 | $35,809 |
Source: Public Records
Map
Nearby Homes
- 613 Murdock Place
- 388 Danforth Dr
- 423 Hathaway Ln
- 610 Murdock Place
- 611 Murdock Place
- 421 Hathaway Ln
- 34 N Adams St
- 170 Chicago Rd
- 55 Garfield St
- 5055 U S 34
- 206 E Washington St
- 177 Franklin St
- 5161 US Highway 34
- 371 S Madison St
- 101 Bell Ct
- 505 Parkland Ct
- 2110 State Route 31
- 125 Presidential Blvd Unit 3248
- 114 Riverview Ct
- 156 River Mist Dr
- 8 W Washington St
- 14 W Washington St
- 78 Main St Unit 1
- 76 Main St
- 11 E Jackson St
- 23 W Washington St
- 58 Main St Unit 58
- 108 Main St
- 56 Main St Unit 56
- 56 Main St Unit 1
- 68 S Madison St
- 73 Main St Unit 2F
- 73 Main St Unit 2R
- 68 N Madison St
- 116 Main St
- 5 E Washington St
- 5 E Washington St Unit C
- 5 E Jackson St
- 12 E Washington St
- 25 S Madison St