Estimated Value: $171,308 - $187,000
1
Bed
1
Bath
2,538
Sq Ft
$71/Sq Ft
Est. Value
About This Home
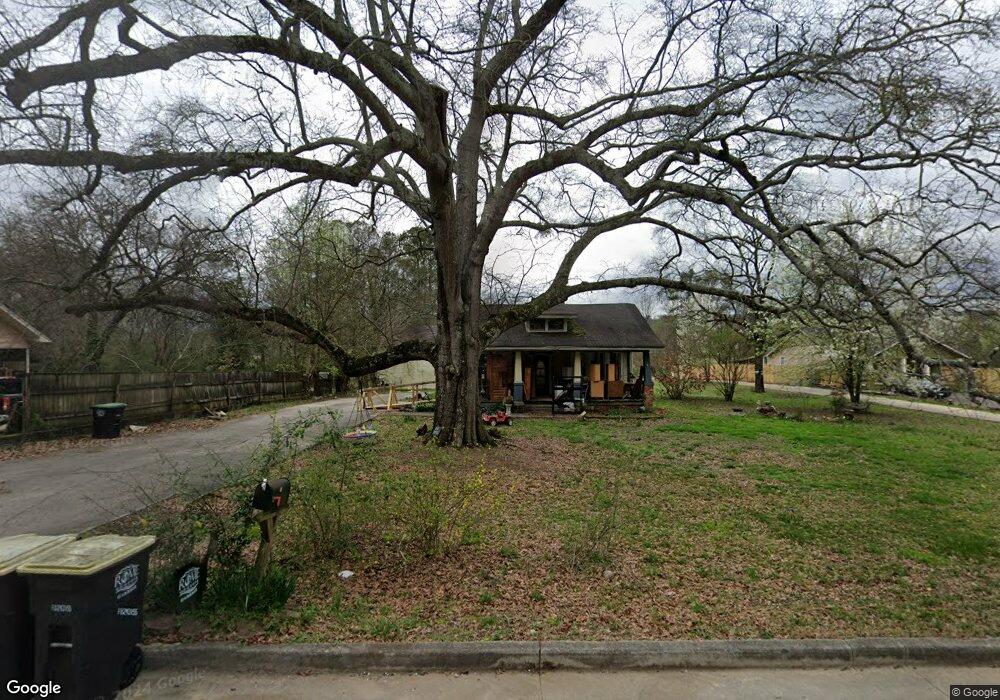
This home is located at 120 Blacks Bluff Rd SW, Rome, GA 30161 and is currently estimated at $179,827, approximately $70 per square foot. 120 Blacks Bluff Rd SW is a home located in Floyd County with nearby schools including Dan McCarty Middle School, Rome High School, and Darlington School.
Ownership History
Date
Name
Owned For
Owner Type
Purchase Details
Closed on
Oct 11, 2023
Sold by
Breaux John L Bates
Bought by
Bates Breaux John L and Kunkle Rhonda Breaux
Current Estimated Value
Home Financials for this Owner
Home Financials are based on the most recent Mortgage that was taken out on this home.
Original Mortgage
$134,518
Outstanding Balance
$131,903
Interest Rate
7.18%
Mortgage Type
FHA
Estimated Equity
$47,924
Purchase Details
Closed on
Feb 24, 2006
Sold by
Not Provided
Bought by
Robbins Donna Jane
Purchase Details
Closed on
Oct 20, 2004
Bought by
P and R
Purchase Details
Closed on
Jun 21, 1995
Sold by
Maynor Melvin and Maynor Evelyn
Bought by
Maynor Evelyn
Purchase Details
Closed on
Oct 11, 1974
Sold by
Doss Mrs C H
Bought by
Maynor Melvin and Maynor Evelyn
Purchase Details
Closed on
Jan 2, 1901
Sold by
Higgins Bulah
Bought by
Doss Mrs C H
Purchase Details
Closed on
Jan 1, 1901
Bought by
Higgins Bulah
Create a Home Valuation Report for This Property
The Home Valuation Report is an in-depth analysis detailing your home's value as well as a comparison with similar homes in the area
Home Values in the Area
Average Home Value in this Area
Purchase History
| Date | Buyer | Sale Price | Title Company |
|---|---|---|---|
| Bates Breaux John L | -- | -- | |
| Bates Breaux John L | $137,000 | -- | |
| Robbins Donna Jane | $30,000 | -- | |
| P | -- | -- | |
| Maynor Evelyn | $27,900 | -- | |
| Maynor Melvin | $27,900 | -- | |
| Doss Mrs C H | -- | -- | |
| Higgins Bulah | -- | -- |
Source: Public Records
Mortgage History
| Date | Status | Borrower | Loan Amount |
|---|---|---|---|
| Open | Bates Breaux John L | $134,518 |
Source: Public Records
Tax History Compared to Growth
Tax History
| Year | Tax Paid | Tax Assessment Tax Assessment Total Assessment is a certain percentage of the fair market value that is determined by local assessors to be the total taxable value of land and additions on the property. | Land | Improvement |
|---|---|---|---|---|
| 2024 | $2,550 | $64,909 | $12,624 | $52,285 |
| 2023 | $2,299 | $59,159 | $11,476 | $47,683 |
| 2022 | $1,712 | $46,923 | $9,543 | $37,380 |
| 2021 | $1,519 | $40,946 | $8,704 | $32,242 |
| 2020 | $1,416 | $37,834 | $7,568 | $30,266 |
| 2019 | $1,327 | $35,858 | $7,568 | $28,290 |
| 2018 | $1,235 | $33,364 | $7,208 | $26,156 |
| 2017 | $1,171 | $31,639 | $6,674 | $24,965 |
| 2016 | $1,098 | $30,848 | $6,640 | $24,208 |
| 2015 | $1,038 | $30,848 | $6,640 | $24,208 |
| 2014 | $1,038 | $30,848 | $6,640 | $24,208 |
Source: Public Records
Map
Nearby Homes
- 2055 Blacks Bluff Rd SW
- 25 Blacks Bluff Rd SW
- 11 Blacks Bluff Rd SW
- 44 Marvin Crowe Dr SW
- 7 Pine Valley Rd SW
- 50 Wallace Dr SW
- 8 Crestwood Dr SW
- 3 Porter St SW
- 529 Branham Ave SW
- 88 Watson Dr SW
- 316 S McLin St SW
- 17 Crestwood Dr SW
- 0 Featherston Rd SW Unit 13890394
- 0 Featherston Rd SW Unit 10512723
- 5 Jervis St SW
- 36 Busby Ln
- 13 N Blanche Ave SW
- 0 Webb St
- 0 Webb St Unit LotWP001 21767756
- 202 Green View Rd SW
- 122 Blacks Bluff Rd SW
- 116 Blacks Bluff Rd SW
- 114 Blacks Bluff Rd SW
- 124 Blacks Bluff Rd SW
- 112 Blacks Bluff Rd SW
- 119 Blacks Bluff Rd SW
- 117 Blacks Bluff Rd SW
- 113 Blacks Bluff Rd SW
- 3 Camp Ln SW
- 201 Blacks Bluff Rd SW
- 108 Blacks Bluff Rd SW
- 206 Blacks Bluff Rd SW
- 109 Blacks Bluff Rd SW
- 121 Blacks Bluff Rd SW
- 208 Blacks Bluff Rd SW
- 210 Blacks Bluff Rd SW
- 205 Blacks Bluff Rd SW
- 107 Blacks Bluff Rd SW
- 207 Blacks Bluff Rd SW
- 38 Blacks Bluff Rd SW