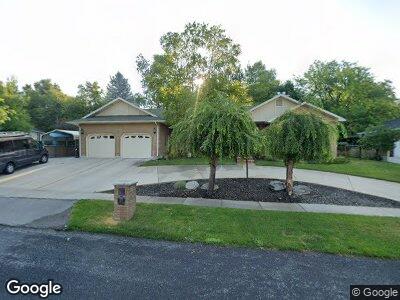
120 Bristol Rd Logan, UT 84341
Hillcrest NeighborhoodEstimated Value: $645,000 - $810,000
5
Beds
3
Baths
4,808
Sq Ft
$153/Sq Ft
Est. Value
About This Home
This home is located at 120 Bristol Rd, Logan, UT 84341 and is currently estimated at $736,565, approximately $153 per square foot. 120 Bristol Rd is a home located in Cache County with nearby schools including Hillcrest Elementary School, Mount Logan Middle School, and Logan High School.
Ownership History
Date
Name
Owned For
Owner Type
Purchase Details
Closed on
May 16, 2014
Sold by
Hicken Gregory J and Hicken Shirlene
Bought by
Hicken Shirlene
Current Estimated Value
Home Financials for this Owner
Home Financials are based on the most recent Mortgage that was taken out on this home.
Original Mortgage
$200,000
Outstanding Balance
$150,249
Interest Rate
3.25%
Mortgage Type
Adjustable Rate Mortgage/ARM
Estimated Equity
$601,106
Purchase Details
Closed on
Mar 30, 2001
Sold by
Nielson Donna W
Bought by
Nielson Donna W
Purchase Details
Closed on
Nov 25, 1996
Sold by
Nielson Thomas A
Bought by
Nielson Donna W
Create a Home Valuation Report for This Property
The Home Valuation Report is an in-depth analysis detailing your home's value as well as a comparison with similar homes in the area
Home Values in the Area
Average Home Value in this Area
Purchase History
| Date | Buyer | Sale Price | Title Company |
|---|---|---|---|
| Hicken Shirlene | -- | Pinnacle Title Ins Agency | |
| Hicken Gregory J | -- | Pinnacle Title Ins Agency | |
| Nielson Donna W | -- | -- | |
| Nielson Donna W | -- | -- |
Source: Public Records
Mortgage History
| Date | Status | Borrower | Loan Amount |
|---|---|---|---|
| Open | Hicken Gregory J | $200,000 |
Source: Public Records
Tax History Compared to Growth
Tax History
| Year | Tax Paid | Tax Assessment Tax Assessment Total Assessment is a certain percentage of the fair market value that is determined by local assessors to be the total taxable value of land and additions on the property. | Land | Improvement |
|---|---|---|---|---|
| 2024 | $3,721 | $466,130 | $0 | $0 |
| 2023 | $3,890 | $464,480 | $0 | $0 |
| 2022 | $3,747 | $417,730 | $0 | $0 |
| 2021 | $3,479 | $599,240 | $65,000 | $534,240 |
| 2020 | $3,291 | $510,200 | $65,000 | $445,200 |
| 2019 | $3,130 | $464,255 | $65,000 | $399,255 |
| 2018 | $2,978 | $403,352 | $65,000 | $338,352 |
| 2017 | $2,721 | $194,845 | $0 | $0 |
| 2016 | $2,821 | $194,845 | $0 | $0 |
| 2015 | $2,824 | $194,845 | $0 | $0 |
| 2014 | $2,066 | $157,650 | $0 | $0 |
| 2013 | -- | $157,650 | $0 | $0 |
Source: Public Records
Map
Nearby Homes