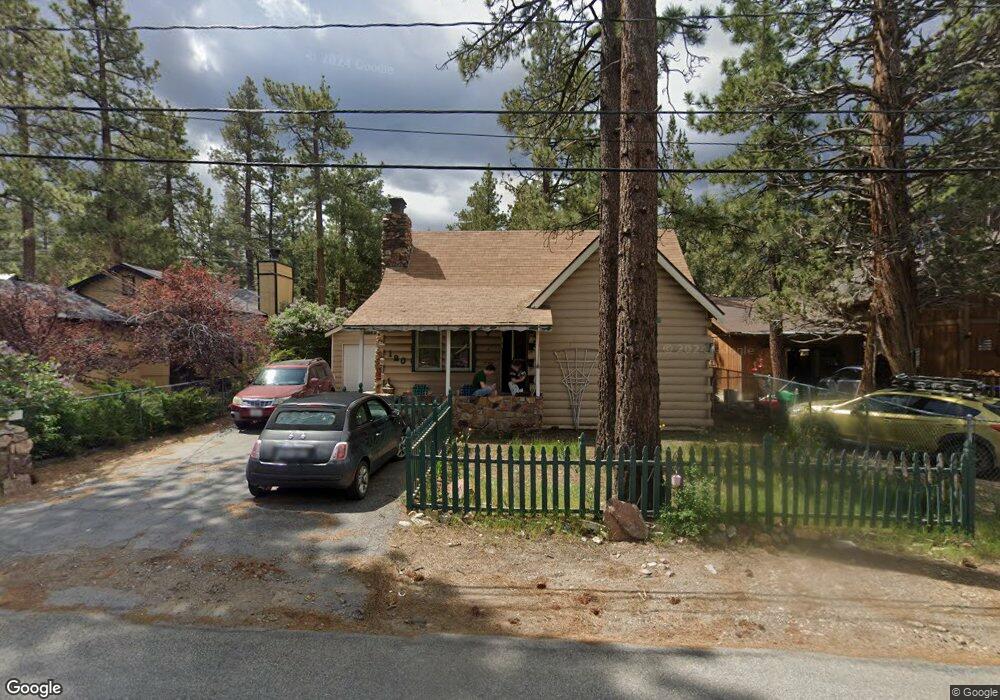
120 E Mojave Blvd Big Bear City, CA 92314
Estimated Value: $358,709 - $412,000
3
Beds
1
Bath
1,110
Sq Ft
$345/Sq Ft
Est. Value
About This Home
This home is located at 120 E Mojave Blvd, Big Bear City, CA 92314 and is currently estimated at $382,427, approximately $344 per square foot. 120 E Mojave Blvd is a home located in San Bernardino County with nearby schools including North Shore Elementary School, Big Bear Middle School, and Big Bear High School.
Ownership History
Date
Name
Owned For
Owner Type
Purchase Details
Closed on
Aug 1, 2024
Sold by
Frank L Schutz And Carol C Schutz Family and Schutz Robert L
Bought by
Baird Ellen E
Current Estimated Value
Purchase Details
Closed on
Feb 21, 2015
Sold by
Monroe Scott and Monroe Lindsay
Bought by
Schutz Carol C and Carol C Schutz Trust
Purchase Details
Closed on
Feb 27, 2004
Sold by
Monroe Arthur S and Monroe Susan E
Bought by
Monroe Scott and Monroe Lindsay
Purchase Details
Closed on
Jan 19, 2001
Sold by
Spurlock John W and Spurlock Lori A
Bought by
Monroe Arthur S and Monroe Susan E
Home Financials for this Owner
Home Financials are based on the most recent Mortgage that was taken out on this home.
Original Mortgage
$78,000
Interest Rate
6.98%
Purchase Details
Closed on
Nov 25, 1996
Sold by
Spurlock John W
Bought by
Spurlock John W and Spurlock Lori A
Create a Home Valuation Report for This Property
The Home Valuation Report is an in-depth analysis detailing your home's value as well as a comparison with similar homes in the area
Home Values in the Area
Average Home Value in this Area
Purchase History
| Date | Buyer | Sale Price | Title Company |
|---|---|---|---|
| Baird Ellen E | -- | None Listed On Document | |
| Schutz Carol C | $92,000 | None Available | |
| Monroe Scott | -- | Southland Title Of Burbank | |
| Monroe Arthur S | $114,000 | First American Title | |
| Spurlock John W | -- | United Title Company |
Source: Public Records
Mortgage History
| Date | Status | Borrower | Loan Amount |
|---|---|---|---|
| Previous Owner | Monroe Arthur S | $78,000 |
Source: Public Records
Tax History
| Year | Tax Paid | Tax Assessment Tax Assessment Total Assessment is a certain percentage of the fair market value that is determined by local assessors to be the total taxable value of land and additions on the property. | Land | Improvement |
|---|---|---|---|---|
| 2025 | $4,947 | $347,300 | $70,467 | $276,833 |
| 2024 | $2,788 | $345,000 | $70,000 | $275,000 |
| 2023 | $2,692 | $150,174 | $28,880 | $121,294 |
| 2022 | $2,581 | $147,230 | $28,314 | $118,916 |
| 2021 | $2,521 | $144,343 | $27,759 | $116,584 |
| 2020 | $2,517 | $142,863 | $27,474 | $115,389 |
| 2019 | $2,488 | $140,061 | $26,935 | $113,126 |
| 2018 | $2,393 | $137,315 | $26,407 | $110,908 |
| 2017 | $2,327 | $134,622 | $25,889 | $108,733 |
| 2016 | $2,268 | $131,982 | $25,381 | $106,601 |
| 2015 | $2,370 | $142,929 | $25,075 | $117,854 |
| 2014 | $2,323 | $140,129 | $24,584 | $115,545 |
Source: Public Records
Map
Nearby Homes
- 112 E Mojave Blvd
- 107 E Aeroplane Blvd
- 108 W Big Bear Blvd
- 125 E Mojave Blvd
- 102 E Country Club Blvd
- 200 E Country Club Blvd
- 225 E Aeroplane Blvd
- 228 E Country Club Blvd
- 108 E Rainbow Blvd
- 329 E Sherwood Blvd
- 326 E Country Club Blvd
- 332 E Country Club Blvd
- 301 E Barker Blvd
- 217 Angeles Blvd
- 221 Angeles Blvd
- 318 W Sherwood Blvd
- 325 E Barker Blvd
- 335 W Sherwood Blvd
- 411 E Fairway Blvd
- 321 Hilltop Ln
- 116 E Mojave Blvd
- 116 W Mojave Blvd
- 124 E Mojave Blvd
- 121 E Sherwood Blvd
- 130 E Mojave Blvd
- 125 W Sherwood Blvd
- 117 E Sherwood Blvd
- 121 E Mojave Blvd
- 117 E Mojave Blvd
- 134 E Mojave Blvd
- 131 W Sherwood Blvd
- 108 E Mojave Blvd
- 139 E Mojave Blvd
- 109 E Sherwood Blvd
- 131 W Mojave Blvd
- 138 E Mojave Blvd
- 135 E Mojave Blvd
- 139 W Sherwood Blvd
- 118 E Big Bear Blvd
- 139 W Mojave Blvd
Your Personal Tour Guide
Ask me questions while you tour the home.