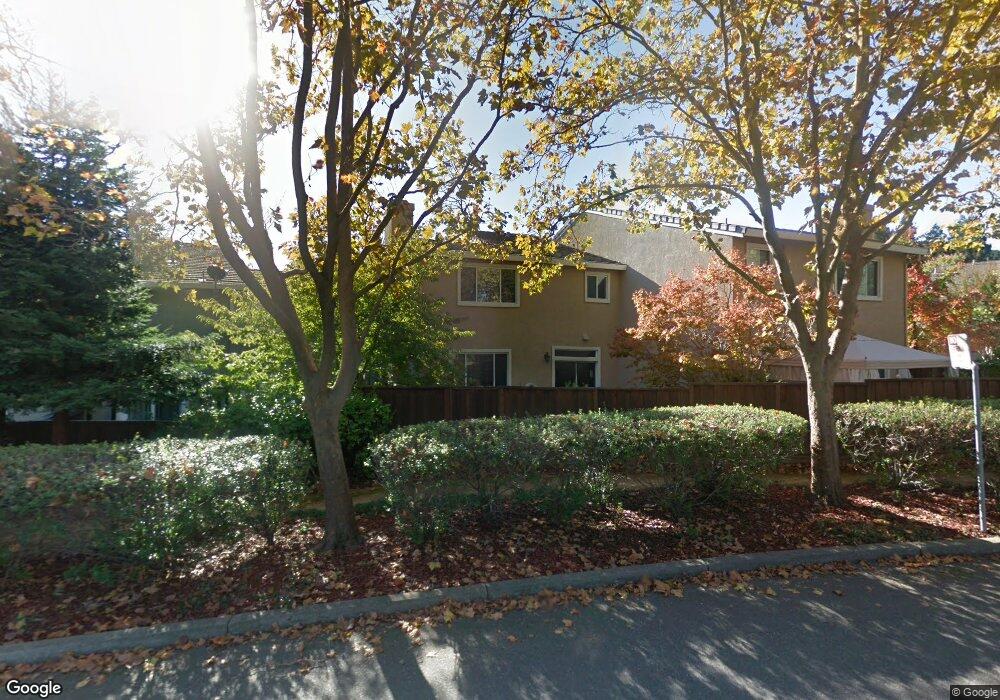
120 Enchanted Way San Ramon, CA 94583
Twin Creeks NeighborhoodEstimated Value: $1,015,000 - $1,287,000
4
Beds
3
Baths
1,912
Sq Ft
$582/Sq Ft
Est. Value
About This Home
This home is located at 120 Enchanted Way, San Ramon, CA 94583 and is currently estimated at $1,113,310, approximately $582 per square foot. 120 Enchanted Way is a home located in Contra Costa County with nearby schools including Twin Creeks Elementary School, Iron Horse Middle School, and California High School.
Ownership History
Date
Name
Owned For
Owner Type
Purchase Details
Closed on
Feb 2, 2021
Sold by
Pennington Rembold Nancy L and Rembold Nancy L
Bought by
Pennington Rembold Nancy L and Pennington Nancy L
Current Estimated Value
Purchase Details
Closed on
Jan 26, 1998
Sold by
Rembold Nancy L
Bought by
Pennington Rembold Nancy L
Home Financials for this Owner
Home Financials are based on the most recent Mortgage that was taken out on this home.
Original Mortgage
$224,200
Outstanding Balance
$39,866
Interest Rate
7.05%
Mortgage Type
Purchase Money Mortgage
Estimated Equity
$1,073,444
Purchase Details
Closed on
Aug 26, 1996
Sold by
Braddock & Logan Group Lp
Bought by
Rembold Nancy L
Home Financials for this Owner
Home Financials are based on the most recent Mortgage that was taken out on this home.
Original Mortgage
$225,102
Interest Rate
8.23%
Mortgage Type
Purchase Money Mortgage
Create a Home Valuation Report for This Property
The Home Valuation Report is an in-depth analysis detailing your home's value as well as a comparison with similar homes in the area
Home Values in the Area
Average Home Value in this Area
Purchase History
| Date | Buyer | Sale Price | Title Company |
|---|---|---|---|
| Pennington Rembold Nancy L | -- | None Available | |
| Pennington Rembold Nancy L | -- | First American Title Guarant | |
| Rembold Nancy L | $237,000 | First American Title Guarant |
Source: Public Records
Mortgage History
| Date | Status | Borrower | Loan Amount |
|---|---|---|---|
| Open | Pennington Rembold Nancy L | $224,200 | |
| Previous Owner | Rembold Nancy L | $225,102 |
Source: Public Records
Tax History Compared to Growth
Tax History
| Year | Tax Paid | Tax Assessment Tax Assessment Total Assessment is a certain percentage of the fair market value that is determined by local assessors to be the total taxable value of land and additions on the property. | Land | Improvement |
|---|---|---|---|---|
| 2025 | $4,877 | $385,809 | $148,194 | $237,615 |
| 2024 | $4,784 | $378,245 | $145,289 | $232,956 |
| 2023 | $4,784 | $370,830 | $142,441 | $228,389 |
| 2022 | $4,745 | $363,560 | $139,649 | $223,911 |
| 2021 | $4,632 | $356,432 | $136,911 | $219,521 |
| 2019 | $4,501 | $345,862 | $132,851 | $213,011 |
| 2018 | $4,327 | $339,082 | $130,247 | $208,835 |
| 2017 | $4,158 | $332,435 | $127,694 | $204,741 |
| 2016 | $4,227 | $325,918 | $125,191 | $200,727 |
| 2015 | $4,157 | $321,023 | $123,311 | $197,712 |
| 2014 | $4,085 | $314,736 | $120,896 | $193,840 |
Source: Public Records
Map
Nearby Homes
- 15 Creekside Dr
- 22 Cobblestone Ct
- 219 Forest Creek Ln
- 2749 Fountainhead Dr
- 2809 Fountainhead Dr
- 2857 Fountainhead Dr
- 663 Abrigo Ct
- 168 Shadowhill Cir
- 732 Fountainhead Ct
- 334 La Paz Ct
- 122 Claremont Crest Ct
- 121 Skyline Dr Unit 5
- 20202 Argento Loop
- 22208 Argento Loop
- 305 Daybreak Ct
- 2720 Marsh Dr
- 407 Daybreak Ct Unit 28
- 437 Ryan Terrace
- 18895 Bollinger Canyon Rd
- 61109 Via Vicenza
- 122 Enchanted Way
- 124 Enchanted Way
- 107 Enchanted Way
- 126 Enchanted Way
- 109 Enchanted Way
- 105 Enchanted Way Unit 68
- 105 Enchanted Way
- 111 Enchanted Way
- 103 Enchanted Way
- 115 Enchanted Way
- 128 Enchanted Way
- 117 Enchanted Way
- 101 Enchanted Way
- 119 Enchanted Way
- 121 Enchanted Way
- 130 Enchanted Way
- 123 Enchanted Way
- 125 Enchanted Way
- 132 Enchanted Way
- 134 Enchanted Way