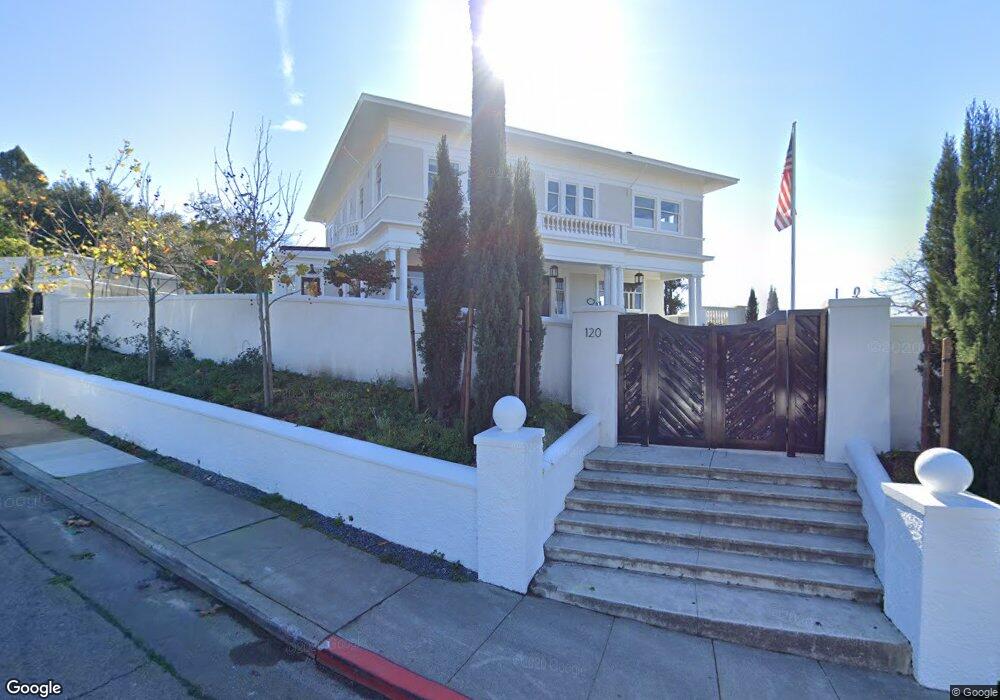
120 Hillcrest Rd Berkeley, CA 94705
Claremont NeighborhoodEstimated Value: $4,343,000 - $5,957,149
4
Beds
3
Baths
4,426
Sq Ft
$1,107/Sq Ft
Est. Value
About This Home
This home is located at 120 Hillcrest Rd, Berkeley, CA 94705 and is currently estimated at $4,898,537, approximately $1,106 per square foot. 120 Hillcrest Rd is a home located in Alameda County with nearby schools including John Muir Elementary School, Emerson Elementary School, and Malcolm X Elementary School.
Ownership History
Date
Name
Owned For
Owner Type
Purchase Details
Closed on
Nov 2, 2017
Sold by
Tokstad Eric Matthew and Janowski Andrew Girard
Bought by
Janowski Andrew G and Tokstad Eric M
Current Estimated Value
Purchase Details
Closed on
Nov 26, 2013
Sold by
Bates Paul Andrew and Bates Family Trust
Bought by
Tokstad Eric Matthew and Janowski Andrew Girard
Purchase Details
Closed on
Jun 10, 2008
Sold by
Bates Thomas J
Bought by
Bates Thomas James Leslie and Bates Family Trust
Purchase Details
Closed on
Apr 3, 2008
Sold by
Bates Thomas J
Bought by
Bates Thomas J
Home Financials for this Owner
Home Financials are based on the most recent Mortgage that was taken out on this home.
Original Mortgage
$1,725,000
Interest Rate
6.27%
Mortgage Type
Reverse Mortgage Home Equity Conversion Mortgage
Create a Home Valuation Report for This Property
The Home Valuation Report is an in-depth analysis detailing your home's value as well as a comparison with similar homes in the area
Home Values in the Area
Average Home Value in this Area
Purchase History
| Date | Buyer | Sale Price | Title Company |
|---|---|---|---|
| Janowski Andrew G | -- | None Available | |
| Tokstad Eric Matthew | $2,450,000 | Chicago Title Company | |
| Bates Thomas James Leslie | -- | None Available | |
| Bates Thomas J | -- | Lenders Choice Title Company |
Source: Public Records
Mortgage History
| Date | Status | Borrower | Loan Amount |
|---|---|---|---|
| Previous Owner | Bates Thomas J | $1,725,000 |
Source: Public Records
Tax History
| Year | Tax Paid | Tax Assessment Tax Assessment Total Assessment is a certain percentage of the fair market value that is determined by local assessors to be the total taxable value of land and additions on the property. | Land | Improvement |
|---|---|---|---|---|
| 2025 | $54,329 | $3,787,185 | $900,970 | $2,886,215 |
| 2024 | $54,329 | $3,712,940 | $883,308 | $2,829,632 |
| 2023 | $53,237 | $3,640,149 | $865,991 | $2,774,158 |
| 2022 | $52,361 | $3,568,782 | $849,013 | $2,719,769 |
| 2021 | $52,555 | $3,498,831 | $832,372 | $2,666,459 |
| 2020 | $49,878 | $3,462,966 | $823,839 | $2,639,127 |
| 2019 | $48,093 | $3,395,084 | $807,691 | $2,587,393 |
| 2018 | $47,336 | $3,328,531 | $791,859 | $2,536,672 |
| 2017 | $44,669 | $3,167,787 | $776,336 | $2,391,451 |
| 2016 | $41,915 | $2,987,047 | $761,114 | $2,225,933 |
| 2015 | $35,749 | $2,498,950 | $749,685 | $1,749,265 |
| 2014 | $35,285 | $2,450,000 | $735,000 | $1,715,000 |
Source: Public Records
Map
Nearby Homes
- 2962 Piedmont Ave
- 204 El Camino Real
- 6100 Chabot Rd
- 6189 Margarido Dr
- 360 Alcatraz Ave
- 5941 Keith Ave
- 5936 Broadway
- 2477 Prince St
- 6446 Colby St
- 1488 Alvarado Rd
- 2817 Palm Ct
- 641 Alvarado Rd
- 0 Tunnel Rd
- 5883 Margarido Dr
- 5668 Buena Vista Ave
- 2643 Stuart St
- 45 Vicente Rd
- 2935 Florence St
- 190 Stonewall Rd
- 0 Gravatt Dr Unit 41122154
- 104 Hillcrest Rd
- 101 Hillcrest Rd
- 98 Hillcrest Rd
- 85 Hillcrest Rd
- 89 Hillcrest Rd
- 5 Hillcrest Ct
- 1 Eucalyptus Rd
- 2 Hillcrest Ct
- 109 Hillcrest Rd
- 115 Hillcrest Rd
- 81 Hillcrest Rd
- 92 Hillcrest Rd
- 35 Hillcrest Rd
- 9 Hillcrest Ct
- 6 Hillcrest Ct
- 11 Eucalyptus Rd
- 29 Hillcrest Rd
- 86 Hillcrest Rd
- 125 Hillcrest Rd
- 50 Hillcrest Rd
Your Personal Tour Guide
Ask me questions while you tour the home.