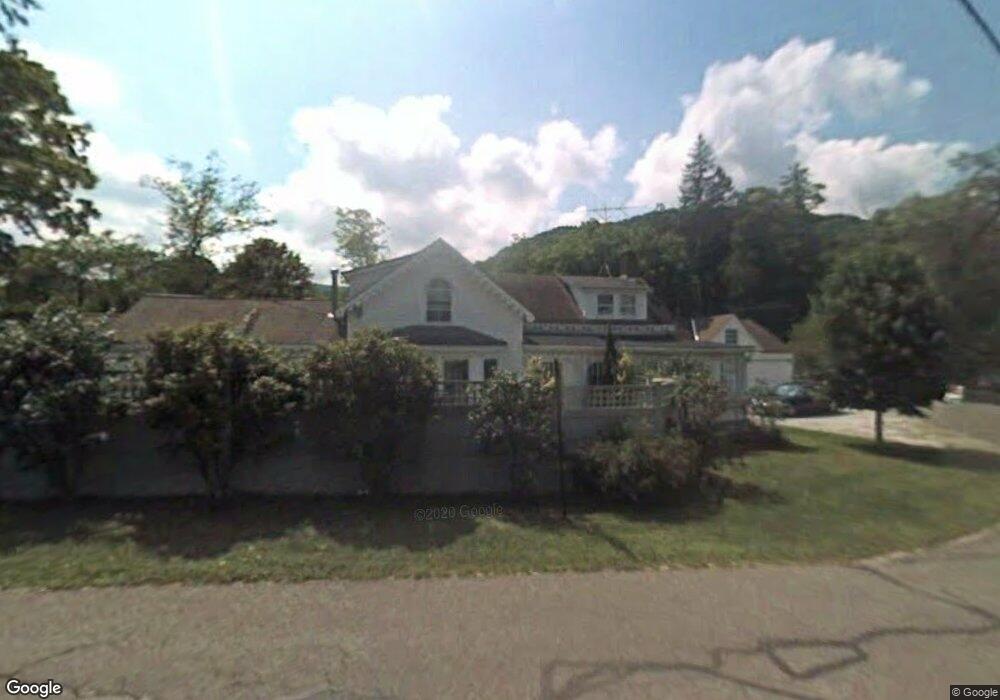
120 Main Rd Tyringham, MA 01264
Estimated Value: $600,889 - $1,262,000
4
Beds
3
Baths
2,057
Sq Ft
$407/Sq Ft
Est. Value
About This Home
This home is located at 120 Main Rd, Tyringham, MA 01264 and is currently estimated at $838,222, approximately $407 per square foot. 120 Main Rd is a home located in Berkshire County with nearby schools including Lee Elementary School and Lee Middle/High School.
Ownership History
Date
Name
Owned For
Owner Type
Purchase Details
Closed on
Dec 5, 2023
Sold by
Rubin Steven J and Moore Jean P
Bought by
Steven J Rubin Ret and Rubin
Current Estimated Value
Purchase Details
Closed on
Nov 18, 2002
Sold by
Deely Philip S and Deely Hilary
Bought by
Rubin Steven J and Moore Jean P
Home Financials for this Owner
Home Financials are based on the most recent Mortgage that was taken out on this home.
Original Mortgage
$205,000
Interest Rate
6.03%
Mortgage Type
Purchase Money Mortgage
Create a Home Valuation Report for This Property
The Home Valuation Report is an in-depth analysis detailing your home's value as well as a comparison with similar homes in the area
Purchase History
| Date | Buyer | Sale Price | Title Company |
|---|---|---|---|
| Steven J Rubin Ret | -- | None Available | |
| Rubin Steven J | $465,000 | -- |
Source: Public Records
Mortgage History
| Date | Status | Borrower | Loan Amount |
|---|---|---|---|
| Previous Owner | Rubin Steven J | $205,000 | |
| Previous Owner | Rubin Steven J | $205,000 |
Source: Public Records
Tax History
| Year | Tax Paid | Tax Assessment Tax Assessment Total Assessment is a certain percentage of the fair market value that is determined by local assessors to be the total taxable value of land and additions on the property. | Land | Improvement |
|---|---|---|---|---|
| 2025 | $3,466 | $566,300 | $54,600 | $511,700 |
| 2024 | $3,338 | $533,300 | $53,100 | $480,200 |
| 2023 | $3,412 | $518,500 | $50,700 | $467,800 |
| 2022 | $3,358 | $499,700 | $50,700 | $449,000 |
| 2021 | $1,627 | $487,800 | $49,200 | $438,600 |
| 2020 | $2,339 | $479,100 | $49,200 | $429,900 |
| 2019 | $1,446 | $478,000 | $49,200 | $428,800 |
| 2018 | $3,283 | $471,700 | $49,200 | $422,500 |
| 2017 | $3,260 | $465,700 | $48,200 | $417,500 |
| 2016 | $3,131 | $464,600 | $48,200 | $416,400 |
| 2015 | $3,083 | $462,900 | $48,200 | $414,700 |
Source: Public Records
Map
Nearby Homes
Your Personal Tour Guide
Ask me questions while you tour the home.