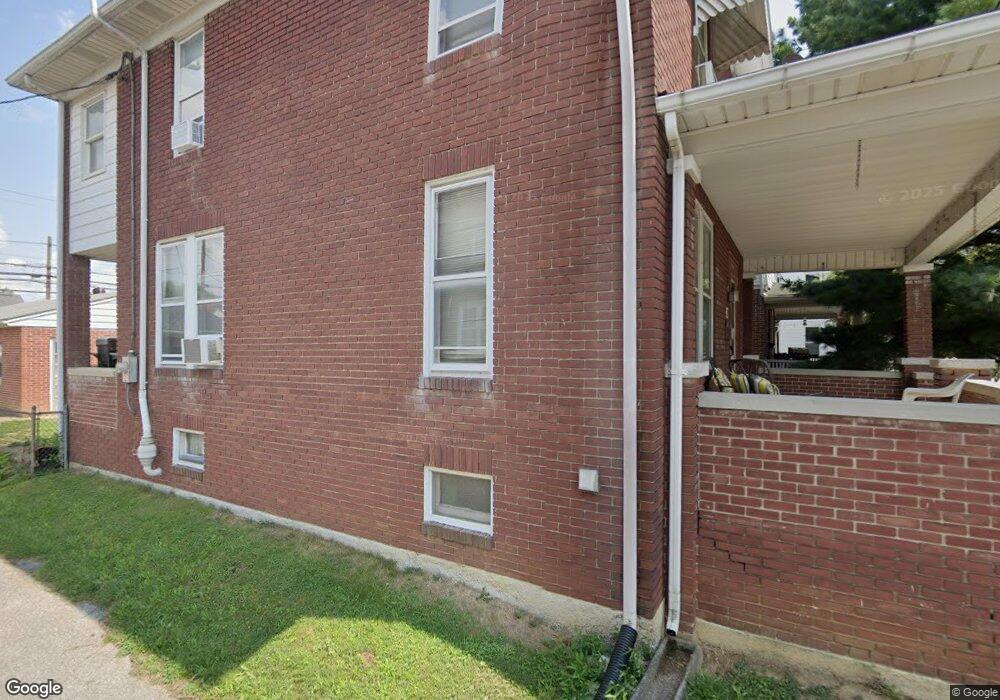
120 Ruth Ave Hanover, PA 17331
Hanover Historic District NeighborhoodEstimated Value: $210,000 - $229,000
3
Beds
2
Baths
1,360
Sq Ft
$163/Sq Ft
Est. Value
About This Home
This home is located at 120 Ruth Ave, Hanover, PA 17331 and is currently estimated at $221,644, approximately $162 per square foot. 120 Ruth Ave is a home located in York County with nearby schools including Hanover Street Elementary School, Hanover Middle School, and Hanover Senior High School.
Ownership History
Date
Name
Owned For
Owner Type
Purchase Details
Closed on
Oct 25, 2011
Sold by
Sites Robert L and Sites Susan
Bought by
Ashbaugh Justin B
Current Estimated Value
Home Financials for this Owner
Home Financials are based on the most recent Mortgage that was taken out on this home.
Original Mortgage
$45,000
Outstanding Balance
$17,969
Interest Rate
4.11%
Mortgage Type
New Conventional
Estimated Equity
$203,675
Purchase Details
Closed on
Oct 5, 1994
Bought by
Sites Robert L and Sites Vera M
Create a Home Valuation Report for This Property
The Home Valuation Report is an in-depth analysis detailing your home's value as well as a comparison with similar homes in the area
Home Values in the Area
Average Home Value in this Area
Purchase History
| Date | Buyer | Sale Price | Title Company |
|---|---|---|---|
| Ashbaugh Justin B | $120,000 | None Available | |
| Sites Robert L | -- | -- |
Source: Public Records
Mortgage History
| Date | Status | Borrower | Loan Amount |
|---|---|---|---|
| Open | Ashbaugh Justin B | $45,000 |
Source: Public Records
Tax History Compared to Growth
Tax History
| Year | Tax Paid | Tax Assessment Tax Assessment Total Assessment is a certain percentage of the fair market value that is determined by local assessors to be the total taxable value of land and additions on the property. | Land | Improvement |
|---|---|---|---|---|
| 2025 | $4,232 | $115,610 | $21,500 | $94,110 |
| 2024 | $4,200 | $115,610 | $21,500 | $94,110 |
| 2023 | $4,168 | $115,610 | $21,500 | $94,110 |
| 2022 | $4,117 | $115,610 | $21,500 | $94,110 |
| 2021 | $4,001 | $115,610 | $21,500 | $94,110 |
| 2020 | $4,001 | $115,610 | $21,500 | $94,110 |
| 2019 | $3,939 | $115,610 | $21,500 | $94,110 |
| 2018 | $3,866 | $115,610 | $21,500 | $94,110 |
| 2017 | $3,793 | $115,610 | $21,500 | $94,110 |
| 2016 | $0 | $115,610 | $21,500 | $94,110 |
| 2015 | -- | $115,610 | $21,500 | $94,110 |
| 2014 | -- | $115,610 | $21,500 | $94,110 |
Source: Public Records
Map
Nearby Homes