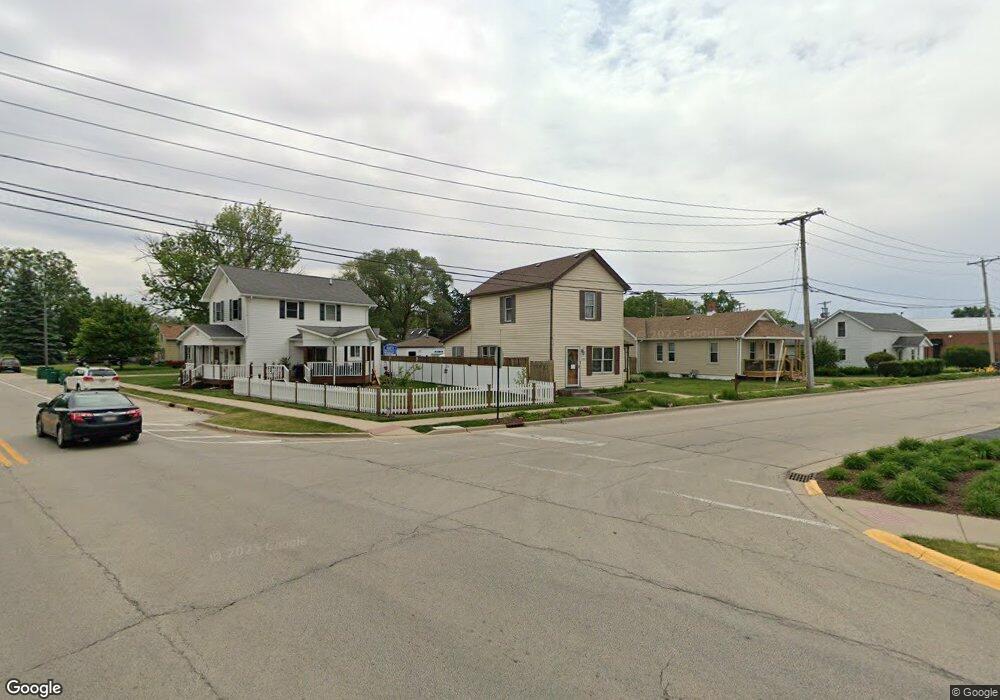
120 S Wabash St Manhattan, IL 60442
Estimated Value: $220,414 - $265,000
3
Beds
1
Bath
1,488
Sq Ft
$163/Sq Ft
Est. Value
About This Home
This home is located at 120 S Wabash St, Manhattan, IL 60442 and is currently estimated at $242,604, approximately $163 per square foot. 120 S Wabash St is a home located in Will County with nearby schools including Wilson Creek Elementary School, Anna McDonald Elementary School, and Manhattan Junior High School.
Ownership History
Date
Name
Owned For
Owner Type
Purchase Details
Closed on
Dec 5, 2013
Sold by
State Bank Of Herscher
Bought by
Dettmering Raymond L and Dettmering Kathy M
Current Estimated Value
Purchase Details
Closed on
Aug 16, 2010
Sold by
Dettmering Raymond L and Dettmering Kathy M
Bought by
State Bank Of Herscher
Purchase Details
Closed on
Mar 27, 1997
Sold by
Tcf Bank Illinois Fsb
Bought by
Dettmering Raymond L and Dettmering Kathy M
Purchase Details
Closed on
Oct 24, 1996
Sold by
Ward Brenda B
Bought by
Tcf Bank Illinois Fsb
Purchase Details
Closed on
Dec 26, 1994
Sold by
Lill Lawrence
Bought by
Hall Steven and Hall Linda L
Home Financials for this Owner
Home Financials are based on the most recent Mortgage that was taken out on this home.
Original Mortgage
$77,770
Interest Rate
10.9%
Create a Home Valuation Report for This Property
The Home Valuation Report is an in-depth analysis detailing your home's value as well as a comparison with similar homes in the area
Home Values in the Area
Average Home Value in this Area
Purchase History
| Date | Buyer | Sale Price | Title Company |
|---|---|---|---|
| Dettmering Raymond L | -- | None Available | |
| State Bank Of Herscher | -- | None Available | |
| Dettmering Raymond L | $45,000 | -- | |
| Tcf Bank Illinois Fsb | -- | -- | |
| Hall Steven | -- | -- |
Source: Public Records
Mortgage History
| Date | Status | Borrower | Loan Amount |
|---|---|---|---|
| Open | Dettmering Raymond L | $400,000 | |
| Previous Owner | Dettmering Kathy M | $155,000 | |
| Previous Owner | Dettmering Kathy M | $156,000 | |
| Previous Owner | Dettmering Ray | $0 | |
| Previous Owner | Hall Steven | $77,770 |
Source: Public Records
Tax History Compared to Growth
Tax History
| Year | Tax Paid | Tax Assessment Tax Assessment Total Assessment is a certain percentage of the fair market value that is determined by local assessors to be the total taxable value of land and additions on the property. | Land | Improvement |
|---|---|---|---|---|
| 2024 | $6,261 | $62,950 | $14,450 | $48,500 |
| 2023 | $6,261 | $55,600 | $13,000 | $42,600 |
| 2022 | $5,692 | $50,400 | $10,550 | $39,850 |
| 2021 | $4,866 | $47,250 | $10,550 | $36,700 |
| 2020 | $4,730 | $45,800 | $10,550 | $35,250 |
| 2019 | $4,593 | $44,600 | $9,700 | $34,900 |
| 2018 | $4,336 | $42,250 | $9,700 | $32,550 |
| 2017 | $4,151 | $40,250 | $9,700 | $30,550 |
| 2016 | $3,997 | $38,550 | $9,700 | $28,850 |
| 2015 | $3,722 | $36,950 | $9,350 | $27,600 |
| 2014 | $3,722 | $35,750 | $9,350 | $26,400 |
| 2013 | $3,722 | $37,100 | $9,350 | $27,750 |
Source: Public Records
Map
Nearby Homes
- 175 S May St
- 340 Jessie St
- 255 S Eastern Ave
- 350 S Park St
- 00 S State St
- 0000 Highway 52
- 435 S State St
- 0000 E Us Highway 52
- 25593 Oconnel Ln
- 25512 Oconnel Ln
- 330 Lee St
- 15130 Oxford Ln
- 15130 W Oxford Ln
- 25043 Clare Cir
- 15120 Oxford Ln
- 15120 W Oxford Ln
- 25910 S Manchester Ln
- 15110 Oxford Ln
- 15100 Oxford Ln
- 15100 W Oxford Ln
- 130 S Wabash St
- 140 S Wabash St
- 225 E North St
- 235 E North St
- 120 Jessie St
- 210 E North St
- 245 E North St
- 220 E North St
- 200 E North St
- 200 E North St Unit 2
- 230 E North St
- 230 Jessie St
- 255 E North St
- 240 E North St
- 240 E North St
- 102 S State St
- 106 S State St
- 108 S State St
- 110 S State St
- 265 E North St