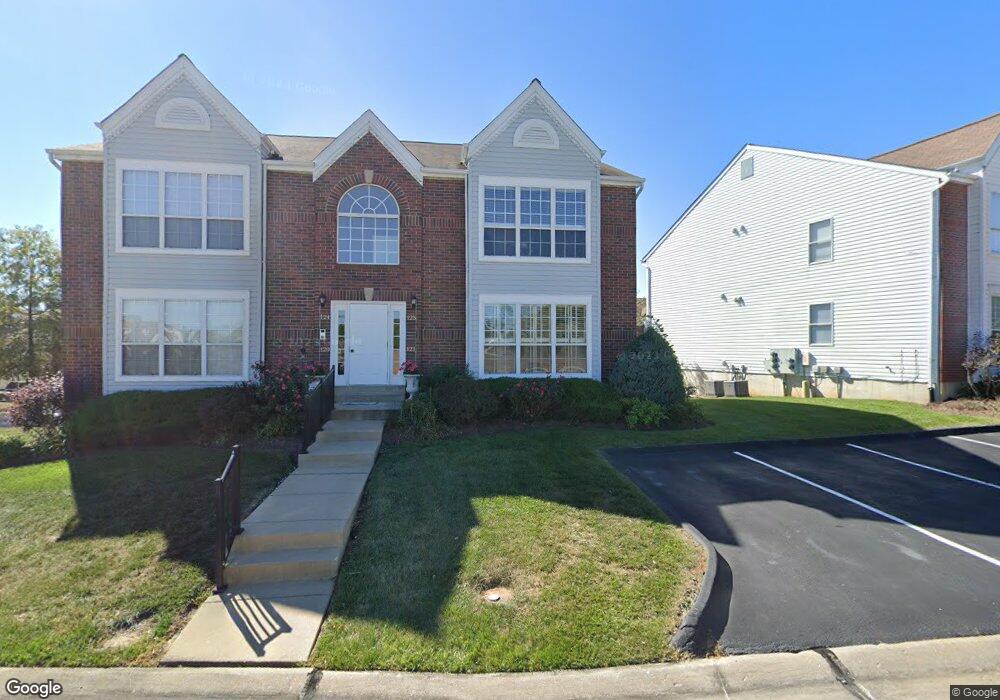
120 Timber Creek Dr Unit A O Fallon, MO 63368
Estimated Value: $188,000 - $204,000
2
Beds
2
Baths
985
Sq Ft
$196/Sq Ft
Est. Value
About This Home
This home is located at 120 Timber Creek Dr Unit A, O Fallon, MO 63368 and is currently estimated at $193,276, approximately $196 per square foot. 120 Timber Creek Dr Unit A is a home located in St. Charles County with nearby schools including Quest Elementary School, Cornwall-on-Hudson Elementary School, and Crossroads Elementary School.
Ownership History
Date
Name
Owned For
Owner Type
Purchase Details
Closed on
Jan 27, 2014
Sold by
Cooley Angelina R
Bought by
Cooley Donald
Current Estimated Value
Purchase Details
Closed on
Sep 24, 2013
Sold by
Advantage Properties Llc
Bought by
Cooley Angelina R
Purchase Details
Closed on
May 21, 2013
Sold by
Bauman Jeannette and Das Acquisition Co Llc
Bought by
Advantage Properties Llc
Purchase Details
Closed on
Mar 31, 2005
Sold by
Morrow Thomas W and Morrow Rose Marie
Bought by
Bauman Jeanette
Home Financials for this Owner
Home Financials are based on the most recent Mortgage that was taken out on this home.
Original Mortgage
$92,000
Interest Rate
5.25%
Mortgage Type
Fannie Mae Freddie Mac
Purchase Details
Closed on
Jun 22, 2000
Sold by
Mcbride & Son Homes Inc
Bought by
Morrow Thomas W and Morrow Rose Marie
Create a Home Valuation Report for This Property
The Home Valuation Report is an in-depth analysis detailing your home's value as well as a comparison with similar homes in the area
Home Values in the Area
Average Home Value in this Area
Purchase History
| Date | Buyer | Sale Price | Title Company |
|---|---|---|---|
| Cooley Donald | -- | None Available | |
| Cooley Angelina R | $83,000 | None Available | |
| Advantage Properties Llc | -- | None Available | |
| Bauman Jeanette | -- | Kts | |
| Morrow Thomas W | -- | -- |
Source: Public Records
Mortgage History
| Date | Status | Borrower | Loan Amount |
|---|---|---|---|
| Previous Owner | Bauman Jeanette | $92,000 |
Source: Public Records
Tax History Compared to Growth
Tax History
| Year | Tax Paid | Tax Assessment Tax Assessment Total Assessment is a certain percentage of the fair market value that is determined by local assessors to be the total taxable value of land and additions on the property. | Land | Improvement |
|---|---|---|---|---|
| 2025 | $1,853 | $30,539 | -- | -- |
| 2023 | $1,854 | $26,708 | $0 | $0 |
| 2022 | $1,624 | $21,759 | $0 | $0 |
| 2021 | $1,628 | $21,759 | $0 | $0 |
| 2020 | $1,546 | $19,932 | $0 | $0 |
| 2019 | $1,452 | $19,932 | $0 | $0 |
| 2018 | $1,361 | $17,766 | $0 | $0 |
| 2017 | $1,338 | $17,766 | $0 | $0 |
| 2016 | $1,381 | $17,594 | $0 | $0 |
| 2015 | $1,361 | $17,594 | $0 | $0 |
| 2014 | $1,279 | $17,757 | $0 | $0 |
Source: Public Records
Map
Nearby Homes
- 701 Balcarra Dr
- 769 Cypress Knoll Dr
- 6998 Route N
- 258 Chestnut Hill Dr
- 128 Dardenne Place Dr
- 1306 Feise Rd
- 116 Dardenne Place Dr
- 2570 Technology Dr
- 276 Greenshire Ln
- 160 Cedarstone Dr
- 209 Autumn Rose Ct
- 243 Greenshire Ln
- 242 Kerry Downs Dr
- 116 Cedarstone Dr
- 0 Chesapeake @ Cedarstone Unit MAR24063701
- 0 Universal Design @ Cedarstone Unit MAR24063686
- 0 Bridgeport @ Cedarstone Unit MAR24063669
- 0 Braxton @ Cedarstone Unit MAR24063663
- 0 Lancaster @ Cedarstone Unit MAR24063683
- 0 Pierce @ Cedarstone Unit MAR24063672
- 121 Timber Creek Dr
- 124 Timber Creek Dr
- 120 Timber Creek Dr
- 124 Timber Creek Dr Unit C
- 125 Timber Creek Dr
- 125 Timber Creek Dr Unit D
- 125 Timber Creek Dr Unit 12D
- 135 Timber Creek Dr
- 135 Timber Creek Dr Unit 13D
- 135 Timber Creek Dr Unit D
- 134 Timber Creek Dr
- 131 Timber Creek Dr
- 130 Timber Creek Dr
- 64 Timber Oaks Trail
- 64 Timber Oaks Trail Unit C
- 50 Timber Oaks Trail
- 50 Timber Oaks Trail Unit 5A
- 65 Timber Oaks Trail
- 61 Timber Oaks Trail Unit B
- 60 Timber Oaks Trail